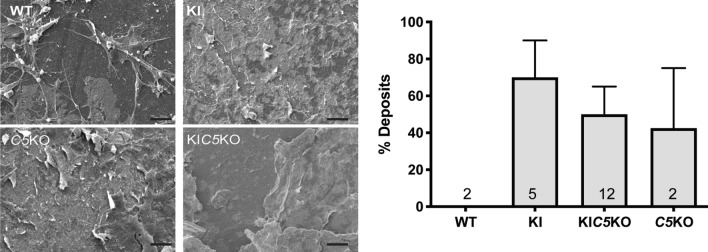
Figure 3.
SM images of flat mounts of the bottom side of the transwell show filopodia that extend from the upper side through the pores of the insert in the Efemp1WT/WT:C5+/+ cultures (WT), vs. deposition of extracellular material in Efemp1R345W/R345W:C5+/+ (KI), Efemp1R345W/R345W:C5-/- (KIC5KO) and Efemp1WT/WT:C5-/- (C5KO) cultures. The graph represents the percentage of deposits measured in SM images using a pinpoint technique (see methods section). Data represented as average ± SEM, the numbers inside the bars indicate the amount of cultures used for quantification for each genotype. Scale bar = 10 μm. N = 2 Efemp1WT/WT:C5+/+ (WT), n = 5 Efemp1R345W/R345W:C5+/+ (KI), n = 12 Efemp1R345W/R345W:C5-/- (KIC5KO), n = 2 Efemp1WT/WT:C5-/- (C5KO).

