

Abstract
We describe the development, optimization, and validation of 384-well growth inhibition assays for six patient-derived melanoma cell lines (PDMCLs), three wild type (WT) for BRAF and three with V600E-BRAF mutations. We conducted a pilot drug combination (DC) high throughput screen (HTS) of forty-five pairwise 4 × 4 DC matrices prepared from 10 drugs in the PDMCL assays; two B-Raf inhibitors (BRAFi), a MEK inhibitor (MEKi), and a methylation agent approved for melanoma, cytotoxic topoisomerase II and DNA methyltransferase chemotherapies, and drugs targeting the base excision DNA repair enzyme Apurinic/Apyrimidinic Endonuclease-1/Redox Effector Factor-1, SRC family tyrosine kinases, the HSP90 molecular chaperone, or histone deacetylases. Pairwise DCs between dasatinib and three drugs approved for melanoma therapy, dabrafenib, vemurafenib, or trametinib, were flagged as synergistic in PDMCLs. Exposure to fixed DC ratios of the SRC inhibitor dasatinib with the BRAFis or MEKis interacted synergistically to increase PDMCL sensitivity to growth inhibition and enhance cytotoxicity independently of PDMCL BRAF status. These DCs synergistically inhibited the growth of mouse melanoma cell lines that were either dabrafenib-sensitive or had acquired resistance to dabrafenib with cross resistance to vemurafenib, trametinib and datatinib. Dasatinib DCs with dabrafenib, vemurafenib or trametinib activated apoptosis and increased cell death in melanoma cells independently of their BRAF status or their drug resistance phenotypes. These pre-clinical in vitro studies provide a data-driven rationale for the further investigation of DCs between dasatinib and BRAFis or MEKis as candidates for melanoma combination therapies with the potential to improve outcomes and/or to prevent or delay the emergence of disease resistance.
Introduction
Melanoma represents <5% of skin cancers but accounts for 80% of skin cancer-related deaths1, 2. Melanoma incidence is rising at ~3% per annum and represents the 6th most common cancer, 5th and 7th in men and women respectively2, 3. In the U.S. in 2020, it is projected that there will be 100,350 new melanoma patients and 6,850 will die of the disease. UV exposure is the predominant risk factor for cutaneous melanoma1, 2. Somatic mutation rates of cutaneous melanoma are significantly higher than other cancers, and the four histologic subtypes (uveal, cutaneous, mucosal, and acral) exhibit considerable heterogeneity in both the number and patterns of driver mutations involved1, 2, 4–6. Thirteen core genes are frequently mutated in melanomas; BRAF, NRAS, TP53, NF1, CDKN2A, ARID2, PTEN, PPP6C, RAC1, IDH1, DDX3X, MAP2K1 and RB15, 6. The largest genomic subtype exhibit BRAF hot-spot mutations, the second is characterized by RAS hot-spot mutations, the third exhibit somatic mutations in NF1, a GTPase-activating protein known to downregulate RAS activity, and the fourth is a heterogeneous subgroup lacking of hot-spot BRAF, N/H/KRAS, or NF1 mutations termed the Triple-WT subtype that features KIT mutations, focal amplifications, and complex structural rearrangements5, 6.
Patients with localized stage I melanomas are largely curable by surgical excision with 5-year survival rates of >98%1, 2, 7. After melanoma progresses to regional or distal sites, 5-year survival declines to 62.4% and 17.9% respectively1, 2, 7. Patients with nonresectable stage III or IV melanoma have a median survival of 6–10 months despite existing systemic therapies1, 2. Dacarbazine and recombinant human interleukin-2 are approved by the FDA for metastatic melanoma1, 2, 7–9. However, these agents yielded objective responses (OR) in ≤ 20% of patients, with no discernable overall benefit to either progression-free survival (PFS) or overall survival (OS)1, 2, 7–9. Several molecularly targeted drugs and immunotherapies have recently been approved for advanced melanoma treatment; drugs that inhibit B-Raf or MEK, and monoclonal antibody (MAbs) immunotherapies that block immune checkpoints (IC-MAbs)3, 7–10. Monotherapy with 1st generation inhibitors of B-Raf (BRAFi, vemurafenib or dabrafenib) or MEK (MEKi, trametinib) significantly improved patient OR rates and prolonged median PFS and OS3, 7–10. BRAFi and MEKi monotherapies were well tolerated with low grade adverse events (AEs) that can be managed3, 8, 11–13. Although BRAFis and MEKis induce rapid disease stabilization with ~ 50% and 22% ORs respectively, PFS is limited to 5–7 months because drug resistance emerges and the disease progresses14–16. 2nd generation BRAFis like encorafenib (BRAFTOVI®) and MEKis cobimetinib (Cotellic®) and binimetinib (MEKTOVI®) exhibit improved efficacy, and the ecorafenib plus binimetinib drug combination (DC) produced median PFS of 14.9 months and OS of 33.6 months for metastatic melanoma17–19. BRAFis plus MEKis DCs are the standard of care treatment for locally advanced or metastatic V600E mutated BRAF melanoma. IC-MAbs such as ipilimumab (anti-cytotoxic T-lymphocyte antigen-4, CTLA-4) or pembrolizumab and nivolumab (anti-programmed cell death-1 protein, PD-1) have lower OR rates, but more durable responses that prolong both median PFS and OS3, 7–10. The clinical benefits of ipilimumab are balanced by low response rates ~10%, slow onset of action, and significant (~25%) autoimmune toxicity10, 20. Pembrolizumab and nivolumab achieve higher clinical response rates, ~20% and 30–40% respectively, with lower (<10%) levels of autoimmune toxicity10, 20. Although small molecule drugs and IC-MAbs have revolutionized melanoma therapy and improved tumor response rates, patient responses are rarely durable, and no cure exists for advanced metastatic melanoma. There is a need to identify new drugs and/or treatment options for the clinical management of melanoma.
Intrinsic and acquired drug resistance are major obstacles to achieving long term clinical benefit for advanced-stage melanoma15, 16, 21–25. 5–20% of melanoma patients don’t respond to BRAFis due to innate resistance mechanisms3, 16, 21, 24, 25. Acquired resistance to single-agent BRAFis develops within 6–7 months due to MAPK signaling reactivation or activation of alternative signaling pathways3, 15, 16, 24–26. Only ~10% of melanoma patients respond to ipilimumab, and most responses are short lived suggesting the emergence of resistance16. Although pembrolizumab and nivolumab achieve higher ORs, PD-1-resistant melanomas exhibit markedly lower T-cell infiltration and lower tumor inflammation10. Single agent cancer therapy rarely provides long term cures due to the genetic complexity and heterogeneity of cancers and their propensity for drug resistance22, 27–32. Animal and clinical studies demonstrate that DCs are more effective than single-agent therapies22, 27–32. The most effective cytotoxic DCs increase tumor cell killing either additively or synergistically by combining agents with different molecular mechanisms and non-overlapping toxicities22, 27–32. DCs are being implemented clinically to improve efficacy in melanoma and to prevent or delay drug resistance9, 15, 16, 25, 33–35. Even though BRAFi plus MEKi DCs improved PFS and OS rates over individual drug treatment, acquired drug resistance is a major limitation to good clinical outcomes3, 33, 35, 36. Immuno-oncology DC strategies are also emerging, either anti-CTLA-4 plus anti-PD-L1 approaches, or combinations of IC-MAbs with small molecule drugs3, 8, 16, 25, 35. However, it is difficult to predict which DCs will effectively provide long-term benefits to patients beyond single agent therapy. Systematic high throughput screening (HTS) of DCs against tumor cell line panels provides an unbiased data driven strategy to identify DCs that might have potential to be developed into effective therapeutic regimens27–32, 37–47.
We implemented a DC HTS campaign in the NCI-60 tumor cell line panel to screen pairwise DC matrices (DCMs) prepared from 100 FDA approved cancer drugs that generated 3.04 million data points to populate A Large Matrix of Anti-Neoplastic Agent Combinations (ALMANAC) database for the NCI39, 40, 42, 43. Selected synergistic DCs from the HTS were confirmed in vitro, potential synergy mechanism of actions (MOAs) were explored, and several DCs exhibited greater than single-agent efficacy in mouse xenograft human cancer models.42 Phase I clinical trial enrollments were opened for the bortezomib plus clofarabine DC in patients with advanced refractory myelodysplastic syndromes and lymphomas (NCT02211755), and for the nilotinib plus paclitaxel DC in adults with refractory solid tumors (NCT02379416). Four DCs flagged in the NCI-60 DC HTS were confirmed to interact synergistically in vitro in several tumor cell lines, and it was shown that interactions between ABC drug efflux inhibitors and their substrates likely contributed to the observed synergy39, 43. Tumor resistance to anticancer drugs that generate DNA adducts is often associated with enhanced Apurinic/Apyrimidinic Endonuclease-1/Redox Effector Factor-1 (APE-1) expression, a critical component of BER40. The APE-1 inhibitor AJAY-4 has a median growth inhibition 50 (GI50) of 4.19 μM across the NCI-60 cell line panel and a DCM with the BRAFi vemurafenib was flagged for synergistic growth inhibition in a DC HTS in the SK-MEL-5 melanoma cell line that expresses V600E mutated B-Raf, but not in SK-MEL-2 cells expressing wild type (WT) B-Raf40. This manuscript describes the development and implementation of an unbiased pairwise DC pilot HTS of 10 selected anticancer agents in patient derived melanoma cell lines (PDMCLs) equally represented by WT and V600E mutant BRAF genotypes. We wished to determine whether the vemurafenib plus AJAY-4 DC would behave synergistically in PDMCLs, if synergy depended upon the BRAF status, and if other novel synergistic DC interactions would be identified. Novel synergistic DCs that are effective in PDMCLs and/or overcome BRAFi or MEKi resistance have the potential to be developed into effective melanoma therapeutic regimens.
Materials and Methods
Reagents
Dimethyl sulfoxide (DMSO) 99.9% high-performance liquid chromatography grade was obtained from Alfa Aesar (Ward Hill, MA). Dulbecco’s Mg2+- and Ca2+-free phosphate-buffered saline (PBS) was purchased from Gibco (Grand Island, NY). Roswell Park Memorial Institute Medium (RPMI-1640) and Dulbecco’s modified Eagle’s medium (DMEM) were purchased from Corning (Manassas, VA). Fetal bovine serum (FBS), L-glutamine (L-glut), HEPES, minimal essential amino acids (MEM), penicillin and streptomycin (P/S) were purchased from Thermo Fisher Scientific (Waltham, MA). Federal Drug Administration (FDA) approved anticancer compounds were obtained from commercial sources and provided by the National Cancer Institute (NCI) Developmental Therapeutics Program (DTP), as previously reported39. The APE-1 inhibitor AJAY-4 was provided by Dr. Barry Gold40, and STA-9090 (Ganetispib®) was obtained from Dr. Walter Storkus. The homogeneous cellular ATP detection reagent Cell Titer Glo® (CTG) and the homogeneous cellular Caspase-Glo® 3/7 apoptosis detection reagents were purchased from Promega Corporation (Madison, WI).
Cancer Drug Mechanisms of Action
Four of the cancer drugs have been approved for the treatment of melanoma: dabrafenib (Tafinlar®) and vemurafenib (Zelboraf®) are B-Raf kinase inhibitors; trametinib (Mekinist®) is MEK1/2 kinase inhibitor; and temozolomide (Temodar®) is a derivative of the methylation agent dacarbazine. AJAY-4 is an inhibitor of the base excision DNA repair enzyme APE-140. Dasatinib (BMS-354825, Sprycel®) is a multi-BCR/Abl and SRC family tyrosine kinase (SFK) inhibitor approved for patients with chronic myelogenous leukemia and acute lymphoblastic leukemia that are Philadelphia chromosome positive. STA9090 (Ganetespib) is an HSP90 inhibitor that is currently in clinical trials, either alone or in combination with other drugs, for a variety of cancers. Romidepsin (Istodax®) is a histone deacetylase inhibitor approved for the treatment of peripheral and cutaneous T-cell lymphomas. The anthracycline antibiotic doxorubicin (Adriamycin) is a DNA intercalator and topoisomerase II inhibitor approved to treat non-Hodgkin’s lymphoma, multiple myeloma, acute leukemias, Kaposi sarcoma, Ewing sarcoma, Wilms tumor, and cancers of the breast, adrenal cortex, endometrium, lung, ovary, and other sites. Decitabine (Dacogen®) is a cytidine analog that inhibits DNA methyltransferase resulting in hypo-methylated DNA that is used for the treatment of myelodysplastic syndromes and for acute myeloid leukemia.
Patient derived melanoma cell lines
Ten patient derived melanoma cell lines (PDMCLs) were established and provided by investigators in the Melanoma and Skin Cancer SPORE at the University of Pittsburgh Medical Center Hillman Cancer Center (Supplementary Table 1). PDMCLs were established between 2007 and 2013 from four female and two male melanoma patients with tumors isolated from different anatomical sites. The cell lines were initiated after manual and enzymatic digestion of resected melanoma tumor samples from patients that had been subjected to a variety of different treatment regimens; individual or combination therapy with high dose interferon-α , interleukin-2, melphalan perfusion, ipilimumab, or vemurafenib. Five of the PDMCLs are wild type (WT) for BRAF and five bear the V600E-BRAF mutation. After receipt of frozen cell pellets the 10 PDMCLs were thawed and placed into tissue culture at 37 °C, 5% CO2 and 95% humidity and expanded through several passages before centrifugation and re-suspension in 10% FBS plus 10% DMSO and freezing in liquid nitrogen. The PDMCLs were maintained in RPMI 1640 medium supplemented with 10% heat inactivated FBS, 1% L-glut, 1% MEM, 1% HEPES, and 100 U/mL penicillin and streptomycin. For quality control purposes, we tracked cell doubling times during the cell expansion and HTS process. PDMCLs were kept in culture for no more than 20 passages.
Murine melanoma cell lines
Two murine melanoma cell lines, BP-WT and BP-R20, were provided by Dr. Ron Fecek (University of Pittsburgh School of Medicine, Pittsburgh, PA). The BP-WT cell line was obtained from Dr. Jen Wargo at MD Anderson and was developed from BRAFV600E mice obtained from the Bosenberg Lab at Yale48. The dabrafenib resistant BP-R20 melanoma population was isolated by Dr. Ron Fecek from BP-WT cells continuously passaged in culture medium containing 20 μM dabrafenib (Chelvanambi M, Fecek RJ, Taylor JL, & Storkus WJ, 2020, Manuscript in preparation). The BP-WT and BP-R20 cell lines were maintained in DMEM medium supplemented with 10% FBS, 1% L-glut, and 1x Pen/Strep. BP-R20 dabrafenib resistance was preserved by supplementing the media with 20 μM Dab at every other passage.
Determination of individual Drug GI50s in Patient Derived Melanoma Cell Lines and the BP-WT and BP-R20 murine melanoma cell lines.
The homogeneous 384-well PDMCL growth inhibition assays using the CTG cellular ATP detection reagent were adapted from previously described tumor cell line GI assays39, 43. Briefly, PDMCLs and murine melanoma cell lines (WT & BP-R20) were harvested by trypsinization, centrifugation, and viable trypan blue excluding cells were counted using a hemocytometer. 45 μL of cells at the appropriate cell density were seeded into the wells of white opaque clear bottomed time 0 (T0) and time 72 h (T72) 384-well barcoded assay plates (Greiner BioOne, Cat # 781098) using a Matrix™ multichannel pipettor (ThermoFisher, Waltham, MA) or a Microflo (BioTek, Winooski, VT) bulk reagent dispenser. T0 and T72 assay plates were then incubated at 37 °C in 5% CO2 and 95% humidity for 24 h. After 24 h, 5 μL of test drugs were transferred into the test wells of the assay plate (0.2% DMSO final) using the 384-well transfer head on a Janus MDT Mini (Perkin Elmer, Waltham, MA) robotic liquid handling platform, plates were centrifuged at 100 x g for 1 minute and returned to an incubator at 37 °C in 5% CO2 and 95% humidity for 72 h. Also, on day 2, the T0 control cell seeding plates were removed from the incubator and 25 μL of the CTG detection reagent was added to the wells using a Matrix™ multichannel pipettor, and after a 15 min incubation at room temperature, the relative luminescence signal (RLUs) of the T0 control plates were captured on the SpectraMax M5e (Molecular Devices LLC, Sunnyvale, CA) microtiter plate reader. After 72 h, assay plates were removed from the incubator, 25 μL of CTG was added to the wells using a Microflo bulk reagent dispenser and after 15 min the RLUs were read on the SpectraMax M5e plate reader. To analyze the growth inhibition data, we used a concentration-response template to process the raw RLU data to % growth, generate HTS assay performance statistics, S:B ratios and Z-factor coefficients, and to fit the data to curves and derive the GI50 values. The % growth (PG) was calculated using the standard NCI-60 protocol, and as described previously39.
Where Ti is the compound well test value at 72 h, Tz is the average of the test values from the T0 control plate at time zero n=384, and C is the average of the test values n=64 in the T72 DMSO (0.2%) control wells. GraphPad Prism 5 software was used to plot and fit data to curves using the sigmoidal concentration response variable slope equation: Y = Bottom + [Top-Bottom]/[1+10^(LogEC50-X)*HillSlope]. Where bottom is the Y value at the bottom plateau, top is the Y value at the top plateau, Log EC50 is the X value when the response is halfway between the bottom and top and the HillSlope describes the steepness of the curve. The growth inhibition 50 (GI50) value represents the concentration at which cell growth was inhibited by 50%, total growth inhibition (TGI) value represents the concentration at which cell growth was fully inhibited, and the lethal concentration 50 (LC50) value represents the concentration at which 50% of the cells were killed.
Preparation of Drug Combination Matrix (DCM) Master and Replica Daughter Plates
For the pilot DC HTS, a total of forty-five pairwise 4 × 4 drug combination matrices were generated from the 10 test compounds and these were arrayed onto 3 × 384-well master plates. In addition to the 9 DC wells, each 4 × 4 DCM contained a DMSO control and three single-drug control wells for each of the two drugs at concentrations tested within the matrix. Source A (40μL) and Source B (20μL) 10 x master plates were arrayed manually using a matrix pipettor (Suppl. Fig. 1). The 384-well transfer head of the Janus MDT Mini platform was used to transfer 20μL from Plate A into Plate B and mix the DC master plates. 20 μL of DMSO was added to single drug wells, and 40 μL to DMSO control wells. The 384-well transfer head of the Janus MDT Mini was used to transfer 2 μL from the DC master plates into barcoded replica daughter plates which were then centrifuged at 50 x g for 5 min, sealed with aluminum foil, and stored at - 20 °C until use.
Patient Derived Melanoma Cell Line Drug Combination Matrix Screening
On day 1 of the assay, PDMCLs were harvested, counted, and seeded in 45 μL of complete growth media at the appropriate cell density into T0 and T72 384-well assay plates using the Multiflo bulk dispenser. On day 2, the T0 control cell seeding plates were removed from the incubator, 25 μL of the CTG was added to the wells and the RLU signals were acquired as described above. Also on day 2, DCM replica daughter plates prepared as described above were thawed at 37 °C and diluted in 98 μL of serum free RPMI 1640 media using a Microfil dispenser to an intermediate drug concentration (2 % DMSO), and then 5 μL were transferred into the test wells of the T72 assay plates using the 384-well transfer head on a Janus MDT Mini robotic liquid handling platform, and the plates were then returned to an incubator at 37 °C in 5% CO2 and 95% humidity for 72 h. On day 5, the compound treated T72 assay plates were removed from the incubator, 25 μL of CTG was added to the wells using a Multiflo bulk reagent dispenser, the RLU signals were captured on the SpectraMax M5e and the % growth (PG) was calculated using the standard NCI-60 protocol as described above.
Drug Interaction Index Score Analysis of HTS Data
To take advantage of our DC HTS strategy where individual drugs are tested in multiple replicates as well as in combination, we developed a drug interaction index scores (DIIS) to classify the interaction status of two drugs39, equation 1:
| Equation 1. |
Where F’AB is the experimentally observed % growth inhibition (%GI) for each drug combination, μA and μB are the sample means of measured replicates of %GI or CLF at X and Y concentrations of drug A or drug B alone; δA and δB are the sample standard deviations of measured replicates of drug A or drug B alone; and N1 and N2 are the number of sample replicates of drug A or drug B alone. The drug interaction score analysis was implemented in MATLAB® (Natick, MA, USA). The drug interaction score calculation is a modification of the Bliss independence model49. The numerator represents the experimentally observed %GI for each DC in the DCM minus the %GI for a Bliss additive effect calculated from the sample means of all measured replicates of the individual concentrations of drug A and drug B alone. It represents the difference between the experimentally observed %GI of a DC and the calculated Bliss additive effect of replicate means of the two drugs individually. The denominator of equation 1 takes advantage of the individual drug concentration replicates and uses the sample standard deviations of measured replicates of drug A and drug B alone to calculate a value for the variability associated with the individual drug measurements which when divided into the difference between the DC %GI and the calculated Bliss independence additivity for the individual drugs can be used to classify the interactions between the two drugs. A DIIS >3 indicates synergy, a DIIS <−3 indicates antagonism, and for −3<DIIS<3 the interaction is additive.
Confirmation of Drug Combinations Scored Synergistic in the Pilot DC HTS
We arrayed 10 × 10 drug combination matrices (DCMs) onto 384-well master plates. Each DCM included 9 × 9 DC wells (81 total) together with nine wells (18 total) containing each of the corresponding individual drug concentrations, and one DMSO control well. Two 10 × 10 DCMs were matrices were arrayed in columns 3 to 22 of the 384-well plates, together with DMSO (0.2%) controls in columns 1, 2, 23, and 24 (n=64). We used the Chou-Talalay Median-Effect model was used to calculate a combination index (CI) score50. CI = (D1/DX1) + (D2/DX2), where D1 and D2 denote the concentrations of compound 1 and compound 2 required to reach an effect of X% as individual drug treatments, while DX1 and DX2 are the concentrations needed in combination to inhibit X% respectively. DCs with CI > 1 exhibit antagonistic interactions, DCs with CI = 1 exhibit additivity, and DCs with CI < 1 exhibit synergistic interactions. The COMPUSYN freeware program was utilized to calculate CI values and evaluate DC synergy as described previously39, 43.
Determination of Apoptosis in Patient Derived and Murine Melanoma Cell Lines
To measure compound induced activation of apoptosis in PDMCLs and the BP-WT and BP-R20 murine melanoma cell lines we used the homogeneous Caspase-Glo® 3/7 reagent (CG-3/7) from Promega (Madison, WI). The CG-3/7 reagent provides a pro-luminescent substrate (Z-DEVD-aminoluciferin) which is cleaved caspase 3/7 to release aminoluciferin a substrate of luciferase used to produce light. The CG-3/7 reagent has been optimized for cell lysis and luciferase output to measure caspase 3/7 activity51, 52. Briefly, PDMCLs and murine melanoma cell lines were harvested by trypsinization, centrifugation, and viable trypan blue excluding cells were counted using a hemocytometer. 45 μL of cells at the appropriate cell density were seeded into the wells of white opaque 384-well barcoded assay plates using a Matrix™ multichannel pipettor. Assay plates were then incubated at 37 °C in 5% CO2 and 95% humidity for 24 h. After 24 h, 5 μL of test drugs were transferred into the test wells of the assay plate (0.2% DMSO final) using the 384-well transfer head on a Janus MDT Mini robotic liquid handling platform, plates were centrifuged at 100 x g for 1 minute and returned to an incubator at 37 °C in 5% CO2 and 95% humidity for 24 h. After 24 h, assay plates were removed from the incubator, 25 μL of CG-3/7 was added to the wells using a Microflo bulk reagent dispenser and after 1 h the relative light units (RLUs) were read on the SpectraMax M5e. GraphPad Prism 5 software was used to plot and fit data to curves using the sigmoidal concentration response variable slope equation described above.
Results
PDMCL Growth Inhibition Assay Development, Validation & Individual Drug GI50 Determinations
To determine whether PDMCLs, WT for BRAF or with V600E-BRAF mutations, would be compatible with 384-well growth conditions we conducted cell seeding density and time course experiments in 10 PDMCLs to select 384-well cell seeding densities that allowed for active proliferation throughout a 96 h culture period with acceptable HTS assay performance statistics (Fig. 1A & 1B, & Suppl. Table 1). Fig. 1A illustrates the linearity (r2= 0.99) of CTG RLU signals with respect to the number of viable cells seeded per well in 384-well assay plates for 6 PDMCLs, and Fig. 1B illustrates their exponential proliferation (r2 >0.93) over time in 384-well culture. To determine and compare the performance and assay quality control statistics of the PDMCL growth assays, cells were seeded into two 384-well assay plates and the CTG signals of control wells (n=32) were captured at T0, 24 h post seeding, and after an additional 72 h in culture (T72), and were used to calculate signal to background ratios (S:B T72:T0) and Z’-factor coefficients (Suppl. Table 1). When seeded at 1,000 cells per well the PDMCLs exhibited relatively slow proliferation rates with doubling times in the 38 h to 68 h range (Fig. 1B & Suppl. Table 1). Four of the PDMCLs, two WT for BRAF (TPF-11–743 & TFP-12–352) and two with V600E-BRAF mutations (TPF-12–524 & TPF-12–338), failed to reproducibly exhibit robust growth in the 384-well plate format (Suppl. Table 1). Even though TPF-11–743 and TFP-12–352 exhibited doubling times of 45 h and 50.7 h respectively, both these WT cell lines cell failed to produce robust and reproducible S:B ratios and Z-factor coefficients that would be compatible with HTS (Suppl. Table 1). Although longer doubling times correspond to lower assay signal windows (S:B ratios), on average five of the six PDMCLs produced Z’-factor coefficients >0.5, indicating they were excellent assays, and the other yielded Z’-factor coefficients of 0.52 and 0.27 in independent experiments. To illustrate that these 384-well growth conditions were suitable for growth inhibition 50 (GI50) determinations we exposed the six PDMCLs to the indicated concentrations of the BRAFi vemurafenib and the APE-1 inhibitor AJAY-4 (Fig 1C & 1D, & Table 1). Two of the V600E-BRAF PDMCLs (TPF-12–207 & TPF-12–542) were substantially (3–5-fold) more sensitive to growth inhibition by vemurafenib than three other (2 × WT & 1 × V600E mutant) cell lines, with one WT PDMCL (1167.1) exhibiting intermediate sensitivity between these two groups (Fig 1C & Table 1). In addition to substantially lower average GI50s, vemurafenib produced more pronounced cytotoxicity in the two sensitive V600E-BRAF PDMCLs (Fig 1C & Table 1). In marked contrast, growth inhibition curves for the APE-1 inhibitor AJAY-4 were superimposable in all six PDMCLs with GI50s ~ 1.25 μM and complete cytotoxicity at concentrations ≥ 2 μM (Fig 1C & Table 1).
Figure 1. Formatting Patient Derived Melanoma Cell Line Growth Inhibition Assays into 384-well Cell Titer Glo® Format and Drug GI50 Determinations.
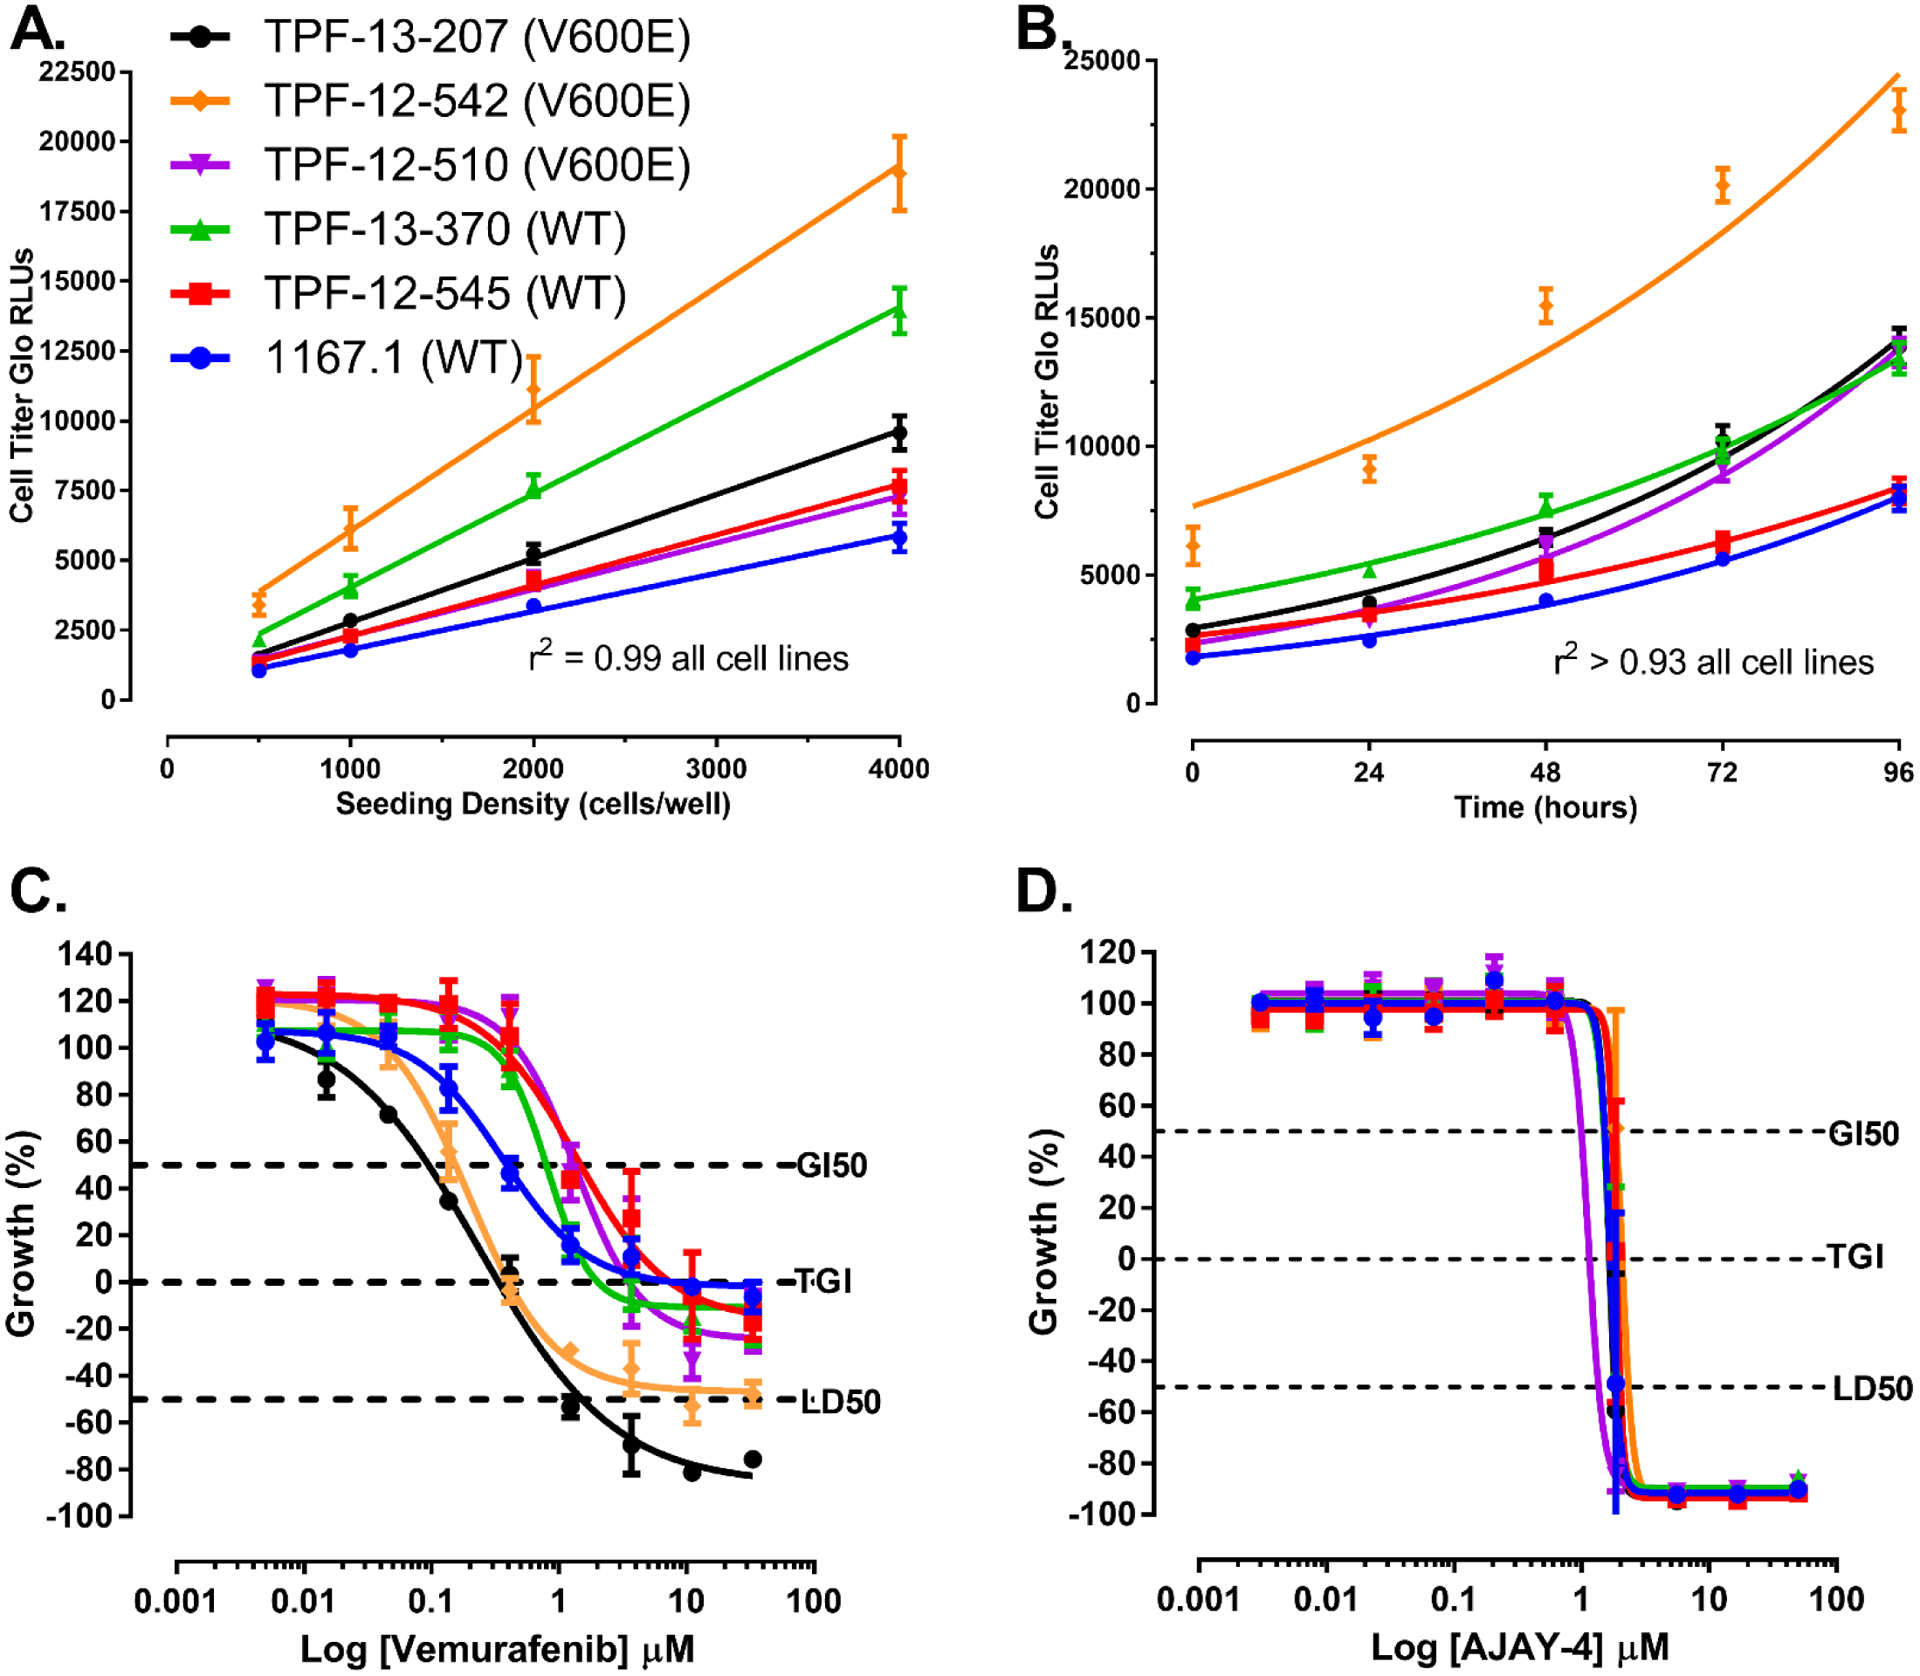
A) Linearity of PDMCL Cell Titer Glo Signal versus Viable Cell Number Linear regression analysis of Cell Titer-Glo (CTG) relative light units (RLUs) produced by seeding the indicated numbers of viable PDMCL cells into the wells of 384-well assay plates. The mean CTG RLUs ± SD (n=32) of twenty-four replicate wells at each seeding density are presented together with the corresponding linear regression analysis of the data, r2 ≥0.99 for all six cell lines. Representative experimental data from one of at least two independent experiments are shown.
B) Exponential PDMCL Cell Growth and Doubling Times Exponential cell growth analysis of the CTG RLUs produced after PDMCLs were seeded into the wells of 384-well assay plates at 1,000 cells per well and cultured in an incubator for the indicated times; The mean CTG RLUs ± SD (n=24) of twenty-four replicate wells at each time point are presented together with the corresponding exponential cell growth analysis of the data, r2 ≥0.93 for all cell six lines. The doubling times 1167.1 WT BRAF, TPF-12–545 WT BRAF, TPF-13–370 WT BRAF, TPF-12–510 V600E-BRAF, TPF-12–542 V600E-BRAF, and TPF-13–207 V600E-BRAF were 44.8 h, 57.5 h, 55.4 h, 37.5 h, 57.4 h, and 42.2 h respectively. Representative data from one experiment is shown.
C) Vemurafenib PDMCL Growth Inhibition Curves The six PDMCLs were seeded into T0 and T72 384-well assay plates and cultured in an incubator for 24h. After 24h, the CTG RLUs signal was captured for the T0 control wells and the indicated concentrations of vemurafenib were transferred into the test wells of the T72 assay plates that were then returned to the incubator for 72h before the CTG RLUs were captured.
D) AJAY-4 PDMCL Growth Inhibition Curves The six PDMCLs were seeded into T0 and T72 384-well assay plates and cultured in an incubator for 24h. After 24h, the CTG RLUs signal was captured for the T0 control wells and the indicated concentrations of AJAY-4 were transferred into the test wells of the T72 assay plates that were then returned to the incubator for 72h before the CTG RLUs were captured.
PDMCL cell lines; 1167.1 WT BRAF (●), TPF-12–545 WT BRAF (■) , TPF-13–370 WT BRAF (▲), TPF-12–510 V600E-BRAF (▼) , TPF-12–542 V600E-BRAF (♦), and TPF-13–207 V600E-BRAF (●).
The % growth (PG) was calculated using the T0 (n=32) and T72 (n=32) DMSO control wells and the standard NCI 60 protocol as described in the methods section. The GI50 value represents the concentration at which cell growth was inhibited by 50%, the TGI value represents the concentration at which cell growth was fully inhibited, and the LC50 value represents the concentration at which 50% of the cells were killed. The mean % growth ± SD (n=3) data from triplicate wells for each drug concentration are presented. Representative growth inhibition data from three independent experiments are shown.
Table 1.
Test Compound Growth Inhibition 50 Values in Patient Derived and Mouse Melanoma Cell Lines
| Patient derived melanoma cell lines Wild type BRAF |
Patient derived melanoma cell lines V600E Mutant BRAF |
Mouse Melanoma cell lines |
||||||||||||||
|---|---|---|---|---|---|---|---|---|---|---|---|---|---|---|---|---|
| Cell Line ID | 1167.1 | TPF-12–352 | TPF-13–370 | TPF-12–510 | TPF-12–542 | TPF-13–207 | BP-WT | BP-R20 | ||||||||
| Compound | GI50 μM | sd | GI50 μM | sd | GI50 μM | sd | GI50 μM | sd | GI50 μM | sd | GI50 μM | sd | GI50 μM | sd | GI50 μM | sd |
| Decitabine | 687 | - | 905 | - | >1000 | >1000 | 583 | - | 909 | - | >1000 | - | >1000 | - | ||
| Temozolomide | 479 | - | >500 | >500 | 464 | 11.5 | >500 | 491 | - | >500 | - | >500 | - | |||
| Dasatinib | <0.005 | - | 0.026 | - | 0.039 | - | 0.126 | - | 1.47 | 0.381 | 0.623 | 0.078 | <0.005 | - | 0.269 | 0.082 |
| Romidepsin | 0.001 | 0.000 | 0.001 | 0.000 | 0.001 | 0.001 | 0.002 | 0.000 | 0.002 | 0.000 | 0.001 | 0.000 | 0.005 | 0.001 | 0.003 | 0.000 |
| Doxorubicin | 0.005 | 0.003 | 0.177 | 0.229 | 0.123 | 0.156 | 0.013 | 0.013 | 0.206 | 0.212 | 0.014 | 0.015 | <0.005 | - | <0.005 | - |
| Dabrafenib | 0.067 | 0.043 | 0.130 | - | 0.130 | 0.003 | >3.3 | - | 0.021 | 0.011 | 0.012 | 0.009 | 0.006 | 0.001 | >10 | - |
| Vemurafenib | 0.471 | 0.070 | 0.968 | 0.453 | 0.818 | 0.316 | 0.996 | 0.445 | 0.223 | 0.059 | 0.145 | 0.043 | 0.076 | 0.008 | 27.919 | 9.342 |
| Trametinib | 0.083 | 0.057 | 0.033 | 0.029 | 0.115 | 0.084 | >5 | - | 0.009 | 0.005 | 0.006 | 0.003 | 0.001 | 0.000 | 0.098 | 0.024 |
| Ganetespib | 0.022 | 0.007 | 0.023 | 0.007 | 0.022 | 0.001 | 0.017 | 0.004 | 0.620 | 0.504 | 0.026 | 0.004 | 0.015 | 0.000 | 0.012 | 0.001 |
| AJAY-4 | 1.13 | 0.335 | 1.37 | 0.475 | 1.00 | 0.445 | 0.920 | 0.061 | 1.79 | 0.254 | 1.55 | 0.044 | 0.923 | 0.193 | 1.252 | 0.490 |
GI50 = mean Growth Inhibition 50 values in μM from 3 independent experiments.
sd = standard deviation of the mean
Where GI50 values are reported for decitabine and temozolomide, they represent data from 1 of 3 independent experiments. In the other two experiments the GI50s were > than the maximum concentration tested, >1000 μM or >500 μM for decitabine and temozolomide respectively.
To further validate the PDMCL 384-well growth inhibition assays and to generate data for the selection of the three individual drug concentrations in the HTS DC matrices we conducted GI50 determinations across the six PDMCLs for all 10 selected anticancer drugs (Table 1 & Suppl. Table 2). The reported mechanisms of action attributed to the drugs selected for the pilot PDMCL DC HTS are presented in supplemental table 2. Neither decitabine nor temozolomide effectively inhibited PDMCL growth in the concentration ranges tested (Table 1). STA-9090, doxorubicin, and romidepsin exhibited mid- to low-nM GI50s, while AJAY-4 exhibited GI50s ~ 1.25 μM across all six PDMCLs (Fig. 1C & Table 1). STA-9090, doxorubicin, romidepsin, and AJAY-4 (Fig. 1D) inhibited the growth of all six PDMCLs irrespective of their BRAF genotypes (Table 1). As described above, vemurafenib produced GI50s in the 0.145 to 1 μM range against the six PDMCLs, with two of the V600E-BRAF PDMCLs (TPF-12–207 & TPF-12–542) showing 3–5-fold more sensitivity to growth inhibition by vemurafenib (Table 1). Dabrafenib, trametinib and dasatinib each inhibited 5 of 6 PDMCLs in the mid- to low-nM GI50 range (Table 1). Dabrafenib produced GI50s in the 0.012 to 0.13 μM range, with one V600E-BRAF PDMCL (TPF-12–501) demonstrating resistance to dabrafenib at concentrations ≤ 3.3 μM (Table 1). Two V600E-BRAF PDMCLs (TPF-12–207 & TPF-12–542) exhibited 3–5-fold more sensitivity to growth inhibition by dabrafenib than PDMCLs WT for BRAF (Table 1). Trametinib produced GI50s in the 0.006 to 0.115 μM range, with one V600E-BRAF PDMCL (TPF-12–501) demonstrating resistance to trametinib at concentrations ≤ 5 μM (Table 1). Again, two V600E-BRAF PDMCLs (TPF-12–207 & TPF-12–542) exhibited 3–5-fold more sensitivity to growth inhibition by trametinib than PDMCLs WT for BRAF (Table 1). Dasatinib produced GI50s ≤623 nM in 5/6 PDMCLs and a GI50 of 1.5 μM in one (TPF-12–542) V600E BRAF PDMCL (Table 1). PDMCLs WT for BRAF were markedly more sensitive to dasatinib (>3-fold) than V600E-BRAF PDMCLs.
Drug Combination Matrix (DCM) Pilot HTS in Patient Derived Melanoma Cell Lines
When the concentration of a single agent achieves a profound inhibition of growth by itself, the remaining response window is too small to detect any synergistic growth inhibition effects of a second agent39. Consistent with previous DC HTS campaigns39, 40, 43 and based on the individual GI50 determination data (Fig 1C & 1D, & Table 1), we selected top concentrations of the 10 drugs for the DC matrices that individually achieved ≤30% GI in the majority of PDMCLs. The middle and low drug concentrations represent 10-fold serial dilutions of the top concentration in the DCM, ensuring that even the most sensitive lines had at least 2 concentrations where growth was not highly inhibited. Whenever possible, concentrations were also selected to be close to or within the range of the human peak plasma concentration (Cmax) at the approved clinical concentration (Suppl. Table 2)53. Each individual drug was tested in pairwise DCs with the nine other test drugs. In addition to 9 DC wells, each 4 × 4 DCM contained a DMSO control and three single-drug control wells for each of the two drugs at concentrations tested within the drug combination matrix (Suppl. Fig. 1A). Supplemental Figure 1B shows how individual drug matrices were arrayed on A and B source plates which were then combined to create a total of forty-five pairwise 4 × 4 DCMs arrayed in 3 × 384-well DCM master plates.
Replica daughter plates prepared from the DCM master plates were used to conduct two independent DC pilot screens in four of the six PDMCLs. The 24 × 384-well PDMCL assay plates of the two independent DC pilot screens passed our quality control criteria with S:B ratios ≥2-fold and Z`-factor coefficients ≥0.25; 19 of 24 assay plates produced Z`-factor coefficients ≥0.5 and the others were ≥0.47. Figure 2 shows representative scatter plots of the % growth inhibition data (Fig. 2A & 2C) relative to DMSO controls, and their corresponding drug interaction index scores (DIIS) (Fig 2B & 2D) from the first iteration of the DC pilot screen in the 1167.1 WT BRAF PDMCL (Fig 2A & 2B), and the TFP-13–207 V600E-BRAF PDMCL (Fig. 2C & 2D). The majority of individual drug treated wells exhibited CTG signals consistent with DMSO controls, indicating that they did not inhibit the growth of the PDMCLs (Fig. 2A & 2C). In contrast, many DC wells produced lower CTG signals consistent with substantial inhibition of PDMCL growth. Figure 2B and 2D depict the corresponding DIISs from the DC HTS; a DIIS >3 indicates synergy, a DIIS <−3 indicates antagonism, and for −3<DIIS<3 the interaction is considered additive. More DIISs ≥3 were observed in DCMs containing dasatinib in combination with either of the BRAFis dabrafenib or vemurafenib, or with the MEKi trametinib. Supplemental Figure 2 shows representative DCM % growth inhibition data and corresponding DIISs for the apparent synergistic inhibition of growth by the dasatinib plus vemurafenib DCM in the TFP-13–207 V600E-BRAF PDMCL.
Figure 2. Unbiased Drug Combination Pilot HTS in Patient Derived Melanoma Cell Line Growth Inhibition Assays.

Each individual drug was tested in pairwise DCs with the nine other test drugs. In addition to 9 DC wells, each 4 × 4 DCM contained a DMSO control and 3 control wells at the individual drug concentrations in the matrix. A total of forty-five pairwise 4 × 4 drug combination matrices were generated from the 10 test compounds and these were arrayed onto 3 × 384-well master plates.
A) Scatter plot of DC pilot HTS % of DMSO control growth data in the 1167.1 PDMCL.
The % of DMSO control growth data are presented from the first iteration of the DC pilot screen conducted in the 1167.1 PDMCL which is WT for BRAF; DMSO control wells are represented by (●) red dots, individual drug treatment control wells are represented by black dots (●) and DCM wells that received DCs are presented by green dots (●)
B) Scatter plot of DC pilot HTS Drug Interaction Index Scores in the 1167.1 PDMCL.
The corresponding drug interaction index scores (DIIS) for the DCM wells that received DCs in the DC pilot screen conducted in the 1167.1 PDMCL which is WT for BRAF are presented (●). DIISs were calculated using equation 1 as described in the methods section and previously39.
C) Scatter plot of DC pilot HTS % of DMSO control growth data in the TFP-13–207 PDMCL.
The % of DMSO control growth data are presented from the first iteration of the DC pilot screen conducted in the TFP-13–207 PDMCL which is V600E for BRAF; DMSO control wells are represented by (●) red dots, individual drug treatment control wells are represented by black dots (●) and DCM wells that received DCs are presented by green dots (●)
D) Scatter plot of DC pilot HTS Drug Interaction Index Scores in the TFP-13–207 PDMCL.
The corresponding drug interaction index scores (DIIS) for the DCM wells that received DCs in the DC pilot screen conducted in the TFP-13–207 PDMCL which is V600E for BRAF are presented (●). DIISs were calculated using equation 1 as described in the methods section and previously39.
Confirmation of Synergistic Drug Interactions Flagged in the Drug Combination Matrix Pilot HTS in Patient Derived Melanoma Cell Lines
To choose DCs flagged synergistic in the PDMCL DC HTS for confirmation, we selected DCMs where synergy had been indicated in multiple DC wells of the DCM and against more than one PDMCL. Only DCMs that contained dasatinib in combination with the BRAFis dabrafenib or vemurafenib, or with the MEKi trametinib, met these criteria. To confirm flagged synergies, we generated an expanded 10 × 10 DCM to test against the PDMCLs39, 40, 43. Figure 3 shows the GI50 determinations and Chou-Talalay median effects model combination index (CI) analysis for the DCs of dasatinib plus dabrafenib, vemurafenib, or trametinib in two PDMCLs; the 1167.1 WT BRAF PDMCL and the TFP-13–207 V600E-BRAF PDMCL. In concentration response curves we present the GI50 curves for individual drugs together with the concentration response for of one of the drugs at a fixed concentration of the other drug. In the combination index plots, selected fixed drug combination ratios extracted from diagonal wells in the 10 × 10 DCMs are presented. In both PDMCLs, exposure to the DC of dasatinib with dabrafenib, vemurafenib, or trametinib dramatically left-shifted the concentration response curves, consistent with substantially enhanced sensitivity relative to treatments with the individual drugs, and produced more cytotoxicity (Fig. 3 A, C, E, G, I & K). Furthermore, multiple fixed dasatinib DC ratios with dabrafenib, vemurafenib, or trametinib produced CI scores <1 in both PDMCLs (Fig. 3 B, D, F, H, J, & L), confirming that these DCs interacted synergistically to inhibit PDMCL growth independently of their BRAF status.
Figure 3. Confirmation of Synergistic Drug Interactions Identified in the Drug Combination Pilot HTS Conducted in Patient Derived Melanoma Cell Line Growth Inhibition Assays.

DCMs that contained dasatinib in combination with the BRAFi’s dabrafenib or vemurafenib, or with the MEKi trametinib, produced DIISs where synergy was indicated in multiple DC wells of a DCM and against more than one PDMCL. Expanded 10 × 10 DCMs were generated to confirm synergies in the PDMCLs39, 40, 43, and we present individual and DC GI50 determinations and Chou-Talalay median effects model combination index (CI) analysis for fixed DC ratios in 1167.1 WT BRAF PDMCL and the TFP-13–207 V600E-BRAF PDMCL.
Growth Inhibition Curves for individual drugs and Dasitinib (Das) DCs with Vemurafenib (Vem), Dabrafenib (Dab), or Trametinib (Tra) in: WT BRAF 1167.1 PDMCL A) Das + Vem, E) Das + Dab, and I) Das + Tra; and V600E-BRAF TFP-13–207 PDMCL C) Das + Vem, G) Das + Dab, and K) Das + Tra. PDMCLs were seeded into T0 and T72 384-well assay plates and cultured in an incubator for 24h. After 24h, the CTG RLUs signal was captured for the T0 control wells and the indicated concentrations of individual drugs or fixed ratio DCs were transferred into the test wells of the T72 assay plates that were then returned to the incubator for 72h before the CTG RLUs were captured. The % growth (PG) was calculated using the standard NCI 60 protocol as described in the methods section. The mean % growth ± SD (n=3) data from triplicate wells for each drug concentration are presented. Das alone blue dots (●), Vem, Dab or Tra alone red dots (●), and Das + fixed concentration of Vem, Dab or Tra purple dots (●). Representative growth inhibition data from three independent experiments are shown.
Combination Index Analysis for Dasatinib (Das) fixed DC ratios with Vemurafenib (Vem), Dabrafenib (Dab), or Trametinib (Tra) in: the WT BRAF 1167.1 PDMCL B) Das:Vem 0.04:1 (●) & 0.01:1 (●), F) Das:Dab 3.3:1 (●) & 10:1 (●), and J) Das:Tra 19.8:1 (●) & 59.1:1 (●); and in the V600E BRAF TFP-13–207 PDMCL D) Das:Vem 0.04:1 (●) & 0.01:1 (●), H) Das:Dab 3.3:1 (●) & 10:1 (●), and L) Das:Tra 2.2:1 (●) & 6.6:1 (●). The growth inhibition/fraction of PDMCL cells affected in the more extensive 10 × 10 DCMs were analyzed in the Chou-Talalay median effects model using the COMPUSYN software to calculate combination index (CI) scores and fit curves for selected fixed ratios of Das in combination with Vem, Dab, or Tra. CI scores <1.0 indicate that two drugs interact synergistically. Representative CI data from one of two independent experiments are shown.
Evaluation of Synergistic Drug Interactions in Murine Melanoma Cell Line Models Sensitive or Resistant to Dabrafenib.
Drug resistance, both intrinsic and acquired, remains a major barrier to the attainment of long term clinical benefit in advanced melanoma15, 16, 21–25. We wanted to explore whether the DCs between dasatanib and BRAFis or MEKis might also behave synergistically in drug resistant melanoma cell lines. The dabrafenib resistant BP-R20 murine melanoma cell population was isolated from BP-WT cells continuously passaged in culture medium containing 20μM dabrafenib. BP-R20 cells were completely resistant to growth inhibition by dabrafenib (≤ 10 μM) while BP-WT cells were exquisitely sensitive with a GI50 ~ 6 nM (Fig. 4A & Table 1). Compared to BP-WT cells, BP-R20 cells also exhibited differential cross resistance to vemurafenib, trametinib and dasatinib (Fig. 4B, 4C & 4D, & Table 1). In contrast, the GI50s for doxorubicin, STA-9090, romidepsin and AJAY-4 (Fig. 4E) were essentially identical in both mouse cell lines (Fig. 4E & Table 1). Fixed DC ratios of dasatinib plus dabrafenib, vemurafenib or trametinib produced CI scores <1 in BP-WT and BP-R20 cell lines (Fig. 4F, 4G & 4H) confirming that they interacted synergistically to inhibit the growth of both sensitive and dabrafenib-resistant mouse melanoma cell lines.
Figure 4. Individual Drug GI50 Determinations and Combination Index Analysis in Dabrafenib Sensitive (BP-WT) and Resistant (BP-R20) Mouse melanoma Cell Lines.

The dabrafenib resistant BP-R20 murine melanoma cell population was isolated from BP-WT cells continuously passaged in culture medium containing 20μM dabrafenib.
A) Dabrafenib, B) Vemurafenib, C) Trametinib, D) Dasatinib and E) AJAY-4 GI50 Curves in BP-WT and BP-R20 Cell Lines. BP-WT and BP-R20 murine melanoma cell lines were seeded into T0 and T72 384-well assay plates and cultured in an incubator for 24h. After 24h, the CTG RLUs signal was captured for the T0 control wells and the indicated concentrations of individual drugs were transferred into the test wells of the T72 assay plates that were then returned to the incubator for 72h before the CTG RLUs were captured. The % growth (PG) was calculated using the standard NCI 60 protocol as described in the methods section. The mean % growth ± SD (n=3) data from triplicate wells for each drug concentration are presented; BP-WT cells (●) and BR-R20 cells (●). Representative growth inhibition data from three independent experiments are shown.
Combination Index Analysis of Dasatinib (Das) fixed DC ratios with Dabrafenib (Dab), Vemurafenib (Vem), or Trametinib (Tra) in BP-WT and BP-R20 Cell Lines; F) Das:Dab 0.04:1, G) Das:Vem 0.11:1, and H) Das:Tra 0.72:1. The growth inhibition/fraction of BR-WT or BP-R20 cells affected by dasatinib fixed combination ratios with dabrafenib, vemurafenib, or trametinib were analyzed in the Chou-Talalay median effects model using the COMPUSYN software to calculate combination index (CI) scores and fit curves; BP-WT cells (●) and BR-R20 cells (●). CI scores <1.0 indicate that two drugs interact synergistically. Representative CI data from one of two independent experiments are shown.
To further investigate the synergy between dasatinib DCs with BRAFis or MEKis we examined their ability to activate apoptosis in four melanoma cell line models; the 1167.1 WT BRAF PDMCL, the TFP-13–207 V600E-BRAF PDMCL, and the BP-WT and dabrafenib-resistant BP-R20 murine melanoma cell lines (Fig. 5). We used the Caspase-Glo® 3/7 reagent to measure the activation of effector caspases-3 and 7 in melanoma cell lines exposed to the individual drugs or dasatinib DCs with dabrafenib, vemurafenib or trametinib for 24 h (Fig. 5). In comparison to the individual drugs, exposure to fixed ratio DCs of dasatinib with dabrafenib, vemurafenib or trametinib increased the levels of apoptosis activation and/or increased the sensitivity (left-shifted the concentration responses) of apoptosis induction (Fig. 5). These data indicate that dasatinib DCs with dabrafenib, vemurafenib or trametinib activated apoptosis and increased cell death in melanoma cells independently of their BRAF status or their drug resistance phenotypes.
Figure 5. Activation of Apoptosis in PDMCLs and Dabrafenib Sensitive and Resistant Mouse melanoma Cell Lines by Individual Drugs and Drug Combinations.

PDMCLs and murine melanoma cell lines were seeded into the wells of assay plates and incubated at 37 °C in 5% CO2 and 95% humidity. After 24 h, the individual test drugs or fixed DC ratios were transferred into the test wells of the assay plate and returned to the incubator. After 24 h, Caspase-Glo® 3/7 reagent was added to the wells and the RLUs were captured.
Apoptosis Activation Curves for Individual Drugs and Fixed DC ratios for Dasatinib (Das) with Dabrafenib (Dab), Vemurafenib (Vem), or Trametinib (Tra) in: the 1167.1 WT BRAF PDMCL A) Das, Vem & 0.11:1 ratio, E) Das, Dab & 0.12:1 ratio, and I) Das, Tra & 2.2:1 ratio; in the V600E-BRAF TFP-13–207 PDMCL B) Das, Vem & 0.11:1 ratio, F) Das, Dab & 0.12:1 ratio, and J) Das, Tra & 2.2:1 ratio; in the BP-WT dabrafenib sensitive cell line C) Das, Vem & 0.11:1 ratio, G) Das, Dab & 0.12:1 ratio, and K) Das, Tra & 2.2:1 ratio; and in the BP-R20 dabrafenib resistant cell line D) Das, Vem & 0.11:1 ratio, H) Das, Dab & 0.12:1 ratio, and L) Das, Tra & 2.2:1 ratio. GraphPad Prism 5 software was used to plot and fit data to curves using the sigmoidal concentration response variable slope equation as described in the methods section. The mean RLUs ± SD (n=3) data from triplicate wells for each drug concentration are presented; Das alone black dots (●), Vem, Dab or Tra alone blue dots (●), and Das + fixed DC ratio of Das plus Vem, Dab or Tra red dots (●). Representative CI data from one of three independent experiments are shown.
Discussion
We describe the development, optimization, and validation of 384-well growth inhibition assays for six PDMCLs, three WT type for BRAF and three with V600E-BRAF mutations (Fig. 1, Table 1 & Suppl. Table 1). PDMCL growth inhibition assays were used to conduct a pilot DC HTS of forty-five pairwise 4 × 4 drug DC matrices prepared from 10 drugs; two BRAFis, a MEKi, and a methylation agent approved for melanoma, cytotoxic topoisomerase II and DNA methyltransferase chemotherapies, and drugs targeting the base excision DNA repair enzyme APE-1, Src family tyrosine kinases, the HSP90 chaperone, and HDACs (Suppl. Table 2). Pairwise DCs between the SFK inhibitor dasatinib and three approved melanoma drugs, dabrafenib, vemurafenib, or trametinib, were flagged synergistic in WT and V600E BRAF PDMCLs (Fig. 2). Exposure to fixed DC ratios of dasatinib plus any of the BRAFis or MEKis interacted synergistically to increase sensitivity to growth inhibition and enhance cytotoxicity independently of PDMCL BRAF status (Fig. 3). Fixed DC ratios of dasatinib plus the BRAFis or MEKis synergistically inhibited the growth of mouse melanoma cell lines that were either sensitive to dabrafenib or had acquired resistance to dabrafenib with cross resistance to vemurafenib, trametinib and datastinib (Fig. 4). Dasatinib DCs with dabrafenib, vemurafenib or trametinib activated apoptosis and increased cell death in melanoma cells independently of their BRAF status or their drug resistance phenotypes (Fig. 5). These pre-clinical in vitro studies provide a data driven rationale to explore DCs between dasatinib and the BRAFis or MEKis as candidates for melanoma combination therapies to improve outcomes and/or to prevent or delay the emergence of resistance.
Dasatinib is a small molecule broad spectrum ATP competitive tyrosine kinase inhibitor that targets BCR-Abl/SRC but also inhibits other SFK members and growth factor receptor tyrosine kinases (RTKs) including c-KIT, c-FMS, PDGFR α and β, discoidin domain receptor 1, and Ephrin-receptors54, 55. Dasatinib has demonstrated robust antiproliferative and antitumor activity against numerous hematologic and solid tumor cell lines in vitro, and exhibited in vivo activity in tumor xenograft models54, 55. In addition to promoting cell cycle arrest, growth inhibition and the induction of apoptosis, dasatinib inhibited angiogenesis, cellular adhesion, migration and invasion, and reduced osteoclast-mediated bone resorption and metastasis54, 55. The SRC family of protein tyrosine kinases (c-SRC, LYN, FYN, LCK, HCK, FGR, BLK, YRK, and YES) are nonreceptor tyrosine kinases that regulate the signal transduction of diverse receptors and intracellular pathways which modulate key cellular processes; growth, proliferation, differentiation, cell shape, adhesion, migration, invasion, angiogenesis, and cell survival54, 56. SFKs have been identified as cellular oncogenes implicated in the development and progression of many cancers including colon, lung, pancreatic, breast, prostate and melanomas54, 56–58. Dasatinib is approved for Acute lymphoblastic leukemia (ALL) and Chronic myelogenous leukemia (CML) that are Philadelphia chromosome positive. Clinical evidence suggests that tyrosine kinase inhibitor (TKI) drugs are associated with adverse effects including cardiotoxicity, dysfunction, or cardiomyocyte damage that may result in cardiovascular complications59. Pooled safety outcomes from dastinib clinical trials have produced mixed conclusions about the significance of cardiotoxicity. Single-arm dasatinib trials revealed a statistically significant QTc prolongation of 3–6 ms in the electroencephalograms (ECG) of patients receiving dasatinib. However, the clinical significance of the QTc prolongation is unresolved since only 1% of patients exceeded a clinically significant threshold of 500 ms, and only 2.9% experienced an elevation beyond a significant threshold of 60 ms from baseline59. Although 4% of patients treated with dasatinib experienced congestive heart failure or ventricular dysfunction, >50% of patients had a prior history of cardiovascular disease. The incidence of cardiovascular ischemia in patients receiving dasatinib was 2%–4%, however most patients had a history of or risk factors for atherosclerosis. When adjusted for age and sex, dasatinib-treated patients did not have a significantly higher risk of cardiovascular ischemia compared to control populations. Superficial edema (11%), fluid retention (27%) and pleural effusion (15%) were observed in the DASISION trial, and 36 months into the follow-up, pulmonary arterial hypertension (PAH) was identified in 3% of patients that received dasatinib59. Dasatinib product labeling currently includes warnings for fluid retention, cardiac ischemia, PAH, and QT prolongation. A search of the clinical trials database (clinicialtrials.gov) returned 294 studies for dasatinib individually (189) or in combination with other agents (105), in a variety of leukemias and solid tumor conditions55. Around 50% of the clinical trials investigating dasatinib administration either alone or in combination have been completed, ~25% were suspended, withdrawn, or terminated, and ~25% remain active with 13% still in the recruiting phase. Six dasatinib studies were listed for melanoma, metastatic, recurrent, stage IIIA melanoma or stage IIIB (NCT00700882, NCT01092728, NCT00436605, & NCT01916135) including one in combination with dacarbazine (NCT00597038) and one with dendritic cell vaccines (NCT01876212). It is unclear whether dasatinib either alone or in combination will be approved for other indications such as melanoma, but it would seem prudent to exercise caution if using dasatinib combinations with cardiotoxic therapies or in patients with a history of cardiovascular disease, and to monitor cardiac function during therapy.
Several pre-clinical studies support the use of SRC inhibitors as therapeutic agents for melanoma36, 54, 55, 57, 58, 60, 61. Melanoma cell lines and tumor samples express SFK members and c-SRC expression is elevated compared to normal melanocytes57, 58. In 124 melanoma patient samples analyzed by immunohistochemistry 77% of tumors were positive for c-SRC expression57, and in 35 samples from patients with primary cutaneous (13), mucosal (13) or metastatic (9) melanomas, 48% of biopsy samples were positive for activated SRC (SRC-pY416)58. In this study, dasatinib produced GI50s ≤623 nM in 5 of 6 PDMCLs tested and a GI50 of 1.5 μM in the TPF-12–542 V600E BRAF PDMCL (Table 1). PDMCLs WT for BRAF were >3-fold sensitive to dasatinib exposure than V600E-BRAF PDMCLs, and the GI50s for 4 of the 6 PDMCLs tested were at or below the clinically attainable 264 nM Cmax of dasatinib53. The dasatinib GI50 data in PDMCLs are in alignment with previously published studies in melanoma cell lines57, 58. In 8 melanoma cell lines, 3 sensitive cell lines displayed >30% growth inhibition after exposure to 155 nM dasatinib for 5-days, while 5 resistant cell lines exhibited <25% growth inhibition after 5-day exposure to 310 nM dasatinib57. In another study, SFK inhibitors dasatinib and bosutinib inhibited the growth of 3 melanoma cell lines with IC50s in the 3–10 μM and 1–6 μM ranges respectively58. In PDMCLs vemurafenib produced GI50s in the 0.145 to 1 μM range, with two of the V600E-BRAF PDMCLs (TPF-12–207 & TPF-12–542) showing 3–5-fold more sensitivity to growth inhibition by vemurafenib (Table 1). PDMCL vemurafenib GI50s are substantially lower than the clinically relevant 127 μM Cmax of vemurafenib53. The two sensitive V600E-BRAF PDMCL vemurafenib GI50s are consistent with a study conducted in WT (7) or V600E mutant (20) BRAF melanoma cell lines, where vemurafenib sensitivity depended on V600E BRAF but was independent of other gene alterations common in melanomas60. In that study, 18 of the 20 V600E BRAF cell lines exhibited vemurafenib IC50s ranging between 0.01 and 1 μM, with 2 resistant V600E BRAF cell lines producing IC50s ~10 μM60. Dabrafenib produced GI50s in the 0.012 to 0.13 μM range with one V600E-BRAF PDMCL (TPF-12–510) demonstrating resistance to dabrafenib at concentrations ≤ 3.3 μM (Table 1). The same two V600E-BRAF PDMCLs (TPF-12–207 & TPF-12–542) exhibited 3–5-fold more sensitivity to growth inhibition by dabrafenib than PDMCLs WT for BRAF (Table 1). Dabrafenib GI50s in PDMCLs are well below the clinically achievable 4.86 μM Cmax of dabrafenib53. Trametinib produced GI50s in the 0.006 to 0.115 μM range in PDMCLs, with one V600E-BRAF PDMCL (TPF-12–510) demonstrating resistance to trametinib at concentrations ≤ 5 μM (Table 1). Again, two V600E-BRAF PDMCLs (TPF-12–207 & TPF-12–542) exhibited 3–5-fold more sensitivity to growth inhibition by trametinib than PDMCLs WT for BRAF (Table 1), and only these PDMCL GI50s were below the clinically relevant 0.021 μM Cmax of trametinib53. Dasatinib DCs with vemurafenib, dabrafenib or trametinib synergistically increased PDMCL sensitivity to growth inhibition and enhanced cell death by activating apoptosis independently of BRAF status (Fig. 3 & 5). It has been shown before that dasatinib DCs with cisplatin, but not with either temozolomide or paclitaxel, synergistically reduced cell viability in melanoma cell lines58.
In the BP-WT mouse melanoma cell line the average GI50s for dabrafenib, vemurafenib, trametinib and dasatinib were 0.006 μM, 0.076 μM, 0.001 μM and <0.005 μM respectively (Fig. 4 & Table 1). In the BP-R20 dabrafenib-resistant mouse melanoma cell line the average GI50s for dabrafenib, vemurafenib, trametinib and dasatinib were >10 μM, 27.9 μM, 0.098 μM and 0.269 μM respectively (Fig. 4 & Table 1). The fold shifts in GI50s between dabrafenib sensitive and resistant murine cell lines for dabrafenib, vemurafenib, trametinib and dasatinib were >1666-fold, 367-fold, 98-fold, and >54-fold respectively (Fig. 4 & Table 1). Murine BP-R20 melanoma cells that had acquired resistance to dabrafenib also exhibited cross resistance to vemurafenib, trametinib and datastinib (Fig. 4 & Table 1). In contrast, the GI50s for doxorubicin, STA-9090, romidepsin and AJAY-4 were essentially identical in the dabrafenib sensitive and resistant mouse melanoma cell lines (Table 1). Dasatinib DCs with the BRAFis or MEKis synergistically inhibited the growth of mouse melanoma cell lines and increased cell death by activating apoptosis independently of their drug resistance phenotypes (Fig. 4 & 5, & Table 1). Our studies agree with two previous reports that have also implicated activation of SRC/SFK signaling in the intrinsic and acquired resistance of melanoma cell lines to vemurafenib60, 61. In two V600E BRAF mutant melanoma cell lines that were intrinsically resistant to vemurafenib (IC50s ~10 μM), phospho-tyrosine analysis revealed activation of the MET proto-oncogene receptor tyrosine kinase axis in one cell line and the SRC/FAK axis in another60. DCs of vemurafenib with MET inhibitors (SU11274) or siRNAs reducing MET expression inhibited cell growth, migration and invasion in the melanoma cell line with MET amplification60. Dasatinib exhibited weak anti-proliferative effects in vemurafenib-resistant melanoma cells with SRC activation, but DCs with vemurafenib displayed significant antiproliferative and cytotoxic effects, reduced cell migration and invasion, decreased MMP-2 production and reduced β1-integrin expression60. Two vemurafenib-resistant V600E BRAF melanoma cell lines with acquired resistance were generated after culturing cells in increasing concentrations of vemurafenib, and a third resistant cell line was established from mouse xenograft models that grew through vemurafenib treatment61. Phospho-array analysis of RTKs that were hyperactivated in vemurafenib-resistant cell lines identified increased phosphorylation of the epidermal growth factor receptor (EGF-R) and downstream pathway components61. The EGF-R inhibitor tyrosine kinase inhibitor gefitinib cooperated with BRAFis to block the growth of vemurafenib-resistant cells in vitro and in vivo61. Elevated phosphorylation of the SFKs LYN, YES and FYN was observed in vemurafenib-resistant melanoma cell lines that were sensitive to growth inhibition by dasatinib both in vitro and in mouse xenograft tumors developed from these cell lines in vivo61. The EGF-R/SRC/STAT3 pathway was activated in vemurafenib-resistant cell lines driving proliferation and stimulating invasion and metastasis61. Inhibition of either EGF-R or SFK signaling overcame BRAFi resistance in melanoma cells in vitro and in vivo61.
Several RTKs have been implicated in melanoma growth and metastasis including c-KIT, PDGFβR and Eph receptor families, prompting the investigation of the broad spectrum BCR-Abl/SRC inhibitor dasatinib that also inhibits SFK members, c-KIT, c-FMS, PDGFR α and β, discoidin domain receptor 1, and Ephrin-receptors, in the melanoma clinical context54, 55, 57, 62–64. In a Phase II study of 36 evaluable patients with stage III/IV chemotherapy naive unresectable melanomas initially administered 100 mg of dasatinib twice daily, it was concluded that dasatinib had minimal activity in unselected melanoma patients64. Two patients exhibited partial responses (response rate 5%), three had minor responses, the median PFS was 8 weeks, and the 6-month PFS rate was 13%64. One patient with a c-KIT mutation had a partial response while another showed disease progression. Dasatinib was poorly tolerated, requiring dose reduction to 70 mg or interruption due to adverse events (AEs), with the most common grade 3/4 AEs being fatigue, dyspnea, pleural effusion, nausea and anorexia64. A phase I clinical trial of dasatinib in combination with dacarbazine was conducted in 51 patients with stage III/IV unresectable melanomas62. Dose expansion cohorts at 3 levels were accrued and dose limiting toxicities were observed at dasatinib 70 mg PO b.i.d., dacarbazine 1000 mg m−2 with the most common grade 3/4 AEs (50% of patients) being neutropenia, anemia and thrombocytopenia62. In 29 patients receiving dasatinib 70 mg PO b.i.d. the OR rate was 13.8%, the 6-month PFS was 20.7%, the 12 month OS was 34.5%, and a phase II dose of dasatinib 70 mg PO b.i.d., dacarbazine 800 mg m−2 was recommended62. A phase II trial of dasatinib was conducted in 57 patients with locally advanced or stage IV mucosal, acral, or vulvovaginal melanoma63. Patients received 70 mg of oral dasatinib twice daily and the worst degree of toxicity observed was grade 3 (44% of patients), with fatigue, dyspnea, nausea, anemia and pleural effusion being the most prevalent AEs in patients63. 5.9% of evaluable patients (51) achieved a partial response, all were KIT-, and in a second stage conducted in KIT+ patients, 18.2% of evaluable patients (22) achieved a partial response63. The median PFS was 2.1 months and median OS was 7.5 months, both were independent of KIT status or subtype63. Due to the low accrual rate and modest clinical activity of dasatinib observed in unresectable KIT+ melanoma it was recommended that imatinib remain the KIT inhibitor of choice for this patient population63. It was concluded that it will be critical to identify predictive mutational profiles and/or biomarkers for the future development of dasatinib in melanoma, either alone or in combination54, 55, 57, 62–64. In that respect, elevated expression of Annexin-A1 (ANXA1), Caveolin-1 (CAV-1) and Ephrin-A2 (EphA2) proteins correlated with dasatinib sensitivity in melanoma cell lines, and 81%, 44% and 74% of 124 melanoma patient tumor samples analyzed by immunohistochemistry were positive for ANXA1, CAV-1 and EphA2 expression respectively57.
In a DC HTS campaign conducted in ten NCI-60 cell lines we identified and confirmed that DCs between the BRAFi vemurafenib and APE-1 inhibitor AJAY-4 synergistically inhibited the growth of the V600E-BRAF SK-MEL-5 melanoma cell line, but not that of the WT BRAF SK-MEL-2 cell line40. The synergy between vemurafenib and AJAY-4 was confirmed in the V600E-BRAF MALME3M and SK-MEL-28 melanoma cell lines, but was not observed in MCF-7 or MDA-MB-468 breast cancer cell lines that are WT for BRAF40. In this study however, the vemurafenib plus AJAY-4 DC did not synergistically inhibit the growth of either WT or V600E BRAF PDMCLs, which may reflect differences in the mutational profiles and/or signaling pathway alterations between PDMCLs and the SK-MEL-5 cell line. SK-MEL-5 cells were isolated more than forty-four years ago65, and genomic comparisons between established cell lines and primary tumors have shown that while many (51%) genetic alterations may be shared at similar mutation frequencies, sub-sets of mutations are unique to patient tumors and cell lines respectively, and those that are unique to cell lines favor immortalization and continuous maintenance in tissue culture66.
The in vitro studies presented here provide a data driven rationale to explore DCs between dasatinib and BRAFis or MEKis as candidates for melanoma combination therapies with the potential to improve outcomes and/or to prevent or delay the emergence of resistance. Effective DC strategies are also a focus of immuno-oncology research, either combinations of immunotherapies or with small molecule chemotherapies and/or targeted drugs3, 8, 16, 25, 35. Several studies suggest that immune responses against mutant forms of BRAF can be harnessed in melanoma to boost antitumor immune responses67. Conversely, increased expression of mediators (IL6, IL10 & VEGF) by V600E BRAF melanoma cells could promote the recruitment of immunosuppressive myeloid-derived suppressor cells (MDSCs) and regulatory T cells (Tregs)67. Clinically relevant concentrations BRAFis do not affect the viability or function of lymphocytes, and BRAFi treatment of melanoma cell lines or primary tumor samples produced enhanced expression of melanocyte differentiation antigens (gp100 & MART-1) important for immune recognition67. There is clinical evidence that melanoma treatment with BRAFis reverses some tumor associated immunosuppressive signals but that the stimulation of immune responses subsides with the emergence of resistance and disease progression67. BRAFis and MEKis may condition the tumor microenvironment to favor immune activation by promoting antigen expression, antigen recognition and T-cell infiltration67. Although it has been reported that dasatinib blocks T-cell activation by inhibiting LCK-mediated T-cell receptor signaling, administration of dasatinib in vivo can enhance T effector cell activation, expansion and function68. In an M05 (B16.OVA) mouse melanoma model, 7-day administration of dasatinib combined with a dendritic cell-based vaccine against an OVA peptide epitope more potently inhibited tumor growth and extended OS compared to the individual treatment groups68. The combination of dasatinib plus vaccine treatment reduced levels of MDSCs and Tregs in the melanoma tumor microenvironment, increased type-1 T-cell CXCR3 ligand recruiting chemokines in the stroma which correlated with recruitment and activation of type-1 CXCR3+CD8+ tumor infiltrating lymphocytes and CD11c+ dendritic cells68. The combination of dasatinib plus vaccine treatment promoted a broader therapeutic CD8+ T-cell repertoire in both the draining lymph nodes and tumor68. In addition to their superior direct antitumor effects, DCs between dasatinib and BRAFis or MEKis might therefore also be beneficial in combination with immunotherapies. Some of the critical safety and efficacy factors that would need to be established for immunotherapies in combination with dasatinib plus BRAFis or MEKis will be optimal dosing, timing, and sequencing regimens. A critical next step for the studies reported herein will be to investigate whether dasatinib DCs with dabrafenib, vemurafenib or trametinib exhibit enhanced in vivo outcomes in mouse PDMCL xenograft models and/or melanoma models of BRAFi resistance. For future DC HTS campaigns it would be important to characterize the mutational profiles of the PDMCLs more extensively beyond their BRAF status to facilitate the investigation of the mechanism of action of synergistic drug interactions. Similarly, increasing the number of approved and/or investigational cancer drugs screened would improve the probability of finding novel DCs with potential to be developed into effective melanoma therapeutic regimens.
Supplementary Material
Acknowledgements.
The authors would like to thank Cindy Sander who provided the patient derived melanoma cell lines and Dr. Ron Fecek for providing the two murine melanoma cell lines, BP-WT and BP-R20. These studies were funded in part by a Developmental Research Project (PI: Johnston) award from the SPORE in Skin Cancer P50 CA121973 (PI: Kirkwood, J.) and awards (R01 CA214018 and P01 CA234212; PI: Walter J. Storkus) at the University of Pittsburgh Medical Center and Hillman Cancer Center.
Abbreviations
- PDMCLs
Patient derived melanoma cell lines
- HTS
High Throughput Screening
- DC
Drug Combination
- DCM
Drug Combination Matrices
- PBS
Dulbecco’s Mg2+ and Ca2+-free phosphate-buffered saline
- DMSO
Dimethyl sulfoxide
- FBS
Fetal Bovine Serum
- DMEM
Dulbecco’s Modified Eagle’s Medium
- P/S
Penicillin / Streptomycin
- CTG
Cell Titer Glo®
- RLUs
Relative Light Units
- GI50
50% growth inhibitory concentration
- TGI
total growth inhibition
- LC50
lethal concentration 50
- FDA
Federal Drug Administration
- EGF
Epidermal Growth Factor
- NCI
National Cancer Institute
- NCI-60
National Cancer Institute panel of 60 tumor cell lines
- ALMANAC
A Large Matrix of Anti-Neoplastic Agent Combinations
- DIIS
drug interaction index scores
- CI
Combination Index
- MOAs
Mechanisms of action
- ABC
ATP binding cassette
- TKI
tyrosine kinase inhibitor
- EGF-R
Epidermal growth factor-receptor
- BRAFi
B-Raf inhibitor
- MEKi
MEK inhibitor
- WT
wild type
- V600E-BRAF
BRAFV600E mutation
- OR
objective responses
- PFS
progression-free survival
- OS
overall survival
- MAbs
monoclonal antibody
- IC-MAbs
monoclonal antibody immunotherapies that block immune checkpoints
- AE
Adverse events
References
- 1.Bertolotto C Melanoma: from melanocyte to genetic alterations and clinical options. Scientifica 2013, 2013, 635203. doi 1155/2013/635203. [DOI] [PMC free article] [PubMed] [Google Scholar]
- 2.Gorantla V, Kirkwood JM. State of melanoma: an historic overview of a field in transition. Hematol Oncol Clin North Am. 2014, 28, 415–435. [DOI] [PMC free article] [PubMed] [Google Scholar]
- 3.Vennepureddy A, Thumallapally N, Motilal Nehru V,et al. Novel Drugs and Combination Therapies for the Treatment of Metastatic Melanoma. J Clin Med Res. 2016, 8, 63–75. [DOI] [PMC free article] [PubMed] [Google Scholar]
- 4.Davar D, Lin Y, Kirkwood JM. Unfolding the mutational landscape of human melanoma. J Invest Dermatol. 2015, 135, 659–662. [DOI] [PMC free article] [PubMed] [Google Scholar]
- 5.Network TCGA Genomic Classification of Cutaneous Melanoma. Cell 2015, 161, 1681–1696. [DOI] [PMC free article] [PubMed] [Google Scholar]
- 6.Zhang T, Dutton-Regester K, Brown KM, et al. The genomic landscape of cutaneous melanoma. Pigment Cell Melanoma Res. 2016, 29, 266–283. [DOI] [PubMed] [Google Scholar]
- 7.Tang T, Eldabaje R, Yang L Current Status of Biological Therapies for the Treatment of Metastatic Melanoma. Anticancer Res. 2016, 36, 3229–41. [PubMed] [Google Scholar]
- 8.Johnson D, Sosman JA. Therapeutic Advances and Treatment Options in Metastatic Melanoma. JAMA Oncol. 2015, 1, 380–386. [DOI] [PubMed] [Google Scholar]
- 9.Michielin O, Hoeller C Gaining momentum: New options and opportunities for the treatment of advanced melanoma. Cancer Treat Rev. 2015, 41, 660–70. [DOI] [PubMed] [Google Scholar]
- 10.Merlino G HM, Fisher DE, Bastian BC, et al. The state of melanoma: challenges and opportunities. Pigment Cell Melanoma Res. 2016, 29, 404–416. [DOI] [PMC free article] [PubMed] [Google Scholar]
- 11.Banzi M, De Blasio S, Lallas A, et al. Dabrafenib: a new opportunity for the treatment of BRAF V600-positive melanoma. Onco Targets Ther. 2016, 9, 2725–33. [DOI] [PMC free article] [PubMed] [Google Scholar]
- 12.Bollag G, Tsai J, Zhang J, et al. Vemurafenib: the first drug approved for BRAF-mutant cancer. Nat Rev Drug Discov. 2012, 11, 873–86. [DOI] [PubMed] [Google Scholar]
- 13.Swaika A, Crozier JA, Joseph RW. Vemurafenib: an evidence-based review of its clinical utility in the treatment of metastatic melanoma. Drug Des Devel Ther. 2014, 16, 775–87. [DOI] [PMC free article] [PubMed] [Google Scholar]
- 14.Lo J, Fisher DE. The melanoma revolution: from UV carcinogensis to a new era of therapeutics. Science 2014, 346, 945–949. [DOI] [PMC free article] [PubMed] [Google Scholar]
- 15.Grazia G, Penna I, Perotti V, et al. Towards combinatorial targeted therapy in melanoma: from pre-clinical evidence to clinical application (review). Int J Oncol. 2014, 45, 929–49. [DOI] [PMC free article] [PubMed] [Google Scholar]
- 16.Tentori L, Lacal PM, Graziani G Challenging resistance mechanisms to therapies for metastatic melanoma. Trends Pharmacol Sci. 2013, 34, 656–66. [DOI] [PubMed] [Google Scholar]
- 17.Dummer R, Ramelyte E, Schindler S, et al. MEK inhibition and immune responses in advanced melanoma. Oncoimmunology 2017, 6, e1335843. doi 10.1080/2162402X.2017.1335843. [DOI] [PMC free article] [PubMed] [Google Scholar]
- 18.Dummer R, Mangana J, Frauchiger AL, Lang C, Micaletto S, Barysch MJ. How I treat metastatic melanoma. ESMO Open 2019, 4, e000509. doi 10.1136/esmoopen-2019-000509. [DOI] [PMC free article] [PubMed] [Google Scholar]
- 19.Koelblinger P, Thuerigen O, Dummer R Development of encorafenib for BRAF-mutated advanced melanoma. Curr Opin Oncol. 2018, 30, 125–133. [DOI] [PMC free article] [PubMed] [Google Scholar]
- 20.Boutros C, Tarhini A, Routier E, et al. Safety profiles of anti-CTLA-4 and anti-PD-1 antibodies alone and in combination. Nat Rev Clin Oncol. 2016, 13, 473–86. [DOI] [PubMed] [Google Scholar]
- 21.Das Thakur M, Stuart DD. Molecular pathways: response and resistance to BRAF and MEK inhibitors in BRAF(V600E) tumors. Clin Cancer Res. 2014, 20, 1074–80. [DOI] [PubMed] [Google Scholar]
- 22.Holohan C, Van Schaeybroeck S, Longley DB, et al. Cancer drug resistance: an evolving paradigm. Nat Rev Cancer. 2013, 13, 714–26. [DOI] [PubMed] [Google Scholar]
- 23.Lovly C, Shaw AT. Molecular pathways: resistance to kinase inhibitors and implications for therapeutic strategies. Clin Cancer Res. 2014, 20, 2249–56. [DOI] [PMC free article] [PubMed] [Google Scholar]
- 24.Rizos H, Menzies AM, Pupo GM, et al. BRAF inhibitor resistance mechanisms in metastatic melanoma: spectrum and clinical impact. Clin Cancer Res. 2014, 20, 1965–77. [DOI] [PubMed] [Google Scholar]
- 25.Welsh S, Rizos H, Scolyer RA, et al. Resistance to combination BRAF and MEK inhibition in metastatic melanoma: Where to next? Eur J Cancer. 2016, 62, 76–85. [DOI] [PubMed] [Google Scholar]
- 26.Kwon CH; Wheeldon I; Kachouie NN; et al. Drug-Eluting Microarrays for Cell-Based Screening of Chemical-Induced Apoptosis. Analytical Chemistry 2011, 83, 4118–4125. [DOI] [PMC free article] [PubMed] [Google Scholar]
- 27.Al-Lazikani B, Banerji U, Workman P Combinatorial drug therapy for cancer in the post-genomic era. Nat Biotechnol. 2012, 30, 679–92. [DOI] [PubMed] [Google Scholar]
- 28.Dancey J, Chen HX. Strategies for optimizing combinations of molecularly targeted anticancer agents. Nat Rev Drug Discov. 2006, 5, 649–659. [DOI] [PubMed] [Google Scholar]
- 29.Keith C, Borisy AA, Stockwell BR. Multicomponent therapeutics for networked systems. Nat Rev Drug Discov. 2005, 4, 71–8. [DOI] [PubMed] [Google Scholar]
- 30.Kummar S, Chen HX, Wright J, et al. Utilizing targeted cancer therapeutic agents in combination: novel approaches and urgent requirements. Nat Rev Drug Discov. 2010, 9, 843–856. [DOI] [PubMed] [Google Scholar]
- 31.Ocaña A, Pandiella A Personalized therapies in the cancer “omics” era. Mol Cancer. 2010, 9, 202–214. [DOI] [PMC free article] [PubMed] [Google Scholar]
- 32.Rodon J, Perez J, Kurzrock R Combining targeted therapies: practical issues to consider at the bench and bedside. The Oncologist 2010, 15, 37–50. [DOI] [PMC free article] [PubMed] [Google Scholar]
- 33.McArthur G Combination Therapies to Inhibit the RAF/MEK/ERK Pathway in Melanoma: We are not Done Yet. Front Oncol. 2015, 5, 161–166. [DOI] [PMC free article] [PubMed] [Google Scholar]
- 34.Verstovsek S, Kantarjian H, Mesa RA, et al. Safety and efficacy of INCB018424, a JAK1 and JAK2 inhibitor, in myelofibrosis. 2010, 363, 1117–1127. [DOI] [PMC free article] [PubMed] [Google Scholar]
- 35.Voskoboynik M, Arkenau HT. Combination therapies for the treatment of advanced melanoma: a review of current evidence. Biochem Res Int. 2014, 2014, 307059. [DOI] [PMC free article] [PubMed] [Google Scholar]
- 36.Kwong L, Davies MA. Targeted therapy for melanoma: rational combinatorial approaches. Oncogene. 2014, 33, 1–9. [DOI] [PubMed] [Google Scholar]
- 37.Axelrod M, Gordon VL, Conaway M, et al. Combinatorial drug screening identifies compensatory pathway interactions and adaptive resistance mechanisms. Oncotarget 2013, 4, 622–635. [DOI] [PMC free article] [PubMed] [Google Scholar]
- 38.Chan G, Wilson S, Schmidt S, et al. Unlocking the Potential of High-Throughput Drug Combination Assays Using Acoustic Dispensing. J Lab Autom. 2015, 21, 125–132. [DOI] [PubMed] [Google Scholar]
- 39.Close DA; Wang AX; Kochanek SJ; et al. Implementation of the NCI-60 Human Tumor Cell Line Panel to Screen 2260 Cancer Drug Combinations to Generate >3 Million Data Points Used to Populate a Large Matrix of Anti-Neoplastic Agent Combinations (ALMANAC) Database. SLAS Discov 2018, 24, 242–263. [DOI] [PubMed] [Google Scholar]
- 40.Feng Z, Kochanek S, Close D, Wang L, Srinivasan A, Almehizia AA, Iyer P, Xie XQ, Johnston PA, Gold B Design and activity of AP endonuclease-1 inhibitors. J. Chem. Biol 2015, 8, 79–93. [DOI] [PMC free article] [PubMed] [Google Scholar]
- 41.Greco WR; Faessel H; Levasseur L The search for cytotoxic synergy between anticancer agents: a case of Dorothy and the ruby slippers? Journal of the National Cancer Institute 1996, 88, 699–700. [DOI] [PubMed] [Google Scholar]
- 42.Holbeck SL; Camalier R; Crowell JA; et al. The National Cancer Institute ALMANAC: A Comprehensive Screening Resource for the Detection of Anticancer Drug Pairs with Enhanced Therapeutic Activity. Cancer Res 2017, 77, 3564–3576. [DOI] [PMC free article] [PubMed] [Google Scholar]
- 43.Kochanek S, Close DA, Wang AX, et al. Confirmation of Selected Synergistic Cancer Drug Combinations Identified in an HTS Campaign and Exploration of Drug Efflux Transporter Contributions to the Mode of Synergy. SLAS Discov. 2019, 24, 653–668. [DOI] [PubMed] [Google Scholar]
- 44.Korfi K; Smith M; Swan J; et al. BIM mediates synergistic killing of B-cell acute lymphoblastic leukemia cells by BCL-2 and MEK inhibitors. Cell Death Dis 2016, 7, e2177. [DOI] [PMC free article] [PubMed] [Google Scholar]
- 45.Mathews Griner L, Guha R, Shinn P, et al. High-throughput combinatorial screening identifies drugs that cooperate with ibrutinib to kill activated B-cell-like diffuse large B-cell lymphoma cells. Proc Natl Acad Sci U S A. 2014, 111, 2349–2354. [DOI] [PMC free article] [PubMed] [Google Scholar]
- 46.O’Neil J, Benita Y, Feldman I, et al. An Unbiased Oncology Compound Screen to Identify Novel Combination Strategies. . Mol Cancer Ther. 2016, 15, 1152–1162. [DOI] [PubMed] [Google Scholar]
- 47.Peifer M, Weiss J, Sos ML, et al. Analysis of compound synergy in high-throughput cellular screens by population-based lifetime modeling. PLoS One. 2010, 5, e8919. [DOI] [PMC free article] [PubMed] [Google Scholar]
- 48.Cooper Z, Juneja VR, Sage PT, et al. Response to BRAF inhibition in melanoma is enhanced when combined with immune checkpoint blockade. Cancer Immunol. Res 2014, 2, 643–654. [DOI] [PMC free article] [PubMed] [Google Scholar]
- 49.Bliss C The toxicity of poisons applied jointly. Ann Appl Biol 1939, 26, 585–615. [Google Scholar]
- 50.Chou T Drug combination studies and their synergy quantification using the Chou-Talalay method. Cancer Res. 2010, 70, 440–446. [DOI] [PubMed] [Google Scholar]
- 51.O’Brien M, Daily WJ, Hesselberth PE, et al. Homogeneous, bioluminescent protease assays: caspase-3 as a model. J Biomol Screen. 2005, 10, 137–148. [DOI] [PubMed] [Google Scholar]
- 52.Riss T, Moravec RA. Use of multiple assay endpoints to investigate the effects of incubation time, dose of toxin, and plating density in cell-based cytotoxicity assays. Assay Drug Dev Technol. 2004, 2, 51–62. [DOI] [PubMed] [Google Scholar]
- 53.Liston D, and Davis, Myrtle. Clinically Relevant Concentrations of Anticancer Drugs: A Guide for Nonclinical Studies. Clin Cancer Res. 2017, 23, 3489–3498. [DOI] [PMC free article] [PubMed] [Google Scholar]
- 54.Aleshin A, and Finn RS. SRC: A Century of Science Brought to the Clinic. Neoplasia 2010, 12, 599–607. [DOI] [PMC free article] [PubMed] [Google Scholar]
- 55.Montero J, Seoane S, Ocaña A, et al. Inhibition of SRC family kinases and receptor tyrosine kinases by dasatinib: possible combinations in solid tumors. Clin Cancer Res. 2011, 17, 5546–5552. [DOI] [PubMed] [Google Scholar]
- 56.Parsons S, and Parsons JT. Src family kinases, key regulators of signal transduction. Oncogene 2004, 23, 7906–7909. [DOI] [PubMed] [Google Scholar]
- 57.Eustace Alex J., Kennedy Susan, Larkin Anne-Marie, et al. Predictive biomarkers for dasatinib treatment in melanoma. Oncoscience. 2014, 1, 158–166. [DOI] [PMC free article] [PubMed] [Google Scholar]
- 58.Homsi J, Cubitt CL, Zhang S, et al. Src activation in melanoma and Src inhibitors as therapeutic agents in melanoma. Melanoma Res. 2009, 19, 167–175. [DOI] [PubMed] [Google Scholar]
- 59.Chaar M, Kamta J, and Ait-Oudhia S Mechanisms, monitoring, and management of tyrosine kinase inhibitors–associated cardiovascular toxicities. OncoTargets and Therapy 2018, 11, 6227–6237. [DOI] [PMC free article] [PubMed] [Google Scholar]
- 60.Vergani Elisabetta, Vallacchi Viviana, Frigerio Simona, et al. Identification of MET and SRC activation in melanoma cell lines showing primary resistance to PLX4032. Neoplasia 2011, 13, 1132–1142. [DOI] [PMC free article] [PubMed] [Google Scholar]
- 61.Girotti Maria R., Pedersen Malin, Sanchez-Laorden Berta, et al. Inhibiting EGF receptor or SRC family kinase signaling overcomes BRAF inhibitor resistance in melanoma. Cancer Discov. 2013, 3, 158–167. [DOI] [PMC free article] [PubMed] [Google Scholar]
- 62.Algazi AP., Weber JS, Andrews SC, et al. Phase I clinical trial of the Src inhibitor dasatinib with dacarbazine in metastatic melanoma. Br J Cancer 2012, 106, 85–91. [DOI] [PMC free article] [PubMed] [Google Scholar]
- 63.Kalinsky K, Lee S, Rubin KM, et al. A phase 2 trial of dasatinib in patients with locally advanced or stage IV mucosal, acral, or vulvovaginal melanoma: A trial of the ECOG-ACRIN Cancer Research Group (E2607). Cancer. 2017, 123, 2688–2697. [DOI] [PMC free article] [PubMed] [Google Scholar]
- 64.Kluger H, Dudek AZ, McCann C, et al. A phase 2 trial of dasatinib in advanced melanoma. Cancer. 2011, 117, 2202–2208. [DOI] [PMC free article] [PubMed] [Google Scholar]
- 65.TE Carey., Takahashi T, Resnick LA, et al. Cell surface antigens of human malignant melanoma: mixed hemadsorption assays for humoral immunity to cultured autologous melanoma cells. Proc Natl Acad Sci U S A 1976, 73, 3278–3282. [DOI] [PMC free article] [PubMed] [Google Scholar]
- 66.Li H, Wawrose JS, Gooding WE, et al. Genomic analysis of head and neck squamous cell carcinoma cell lines and human tumors: a rational approach to preclinical model selection. Mol Cancer Res. 2014, 12, 571–582. [DOI] [PMC free article] [PubMed] [Google Scholar]
- 67.Ilieva K, Correa I, Josephs DH, et al. Effects of BRAF mutations and BRAF inhibition on immune responses to melanoma. Mol Cancer Ther. 2014, 13, 2769–83. [DOI] [PMC free article] [PubMed] [Google Scholar]
- 68.Lowe D, Bose A, Taylor JL, et al. Dasatinib promotes the expansion of a therapeutically superior T-cell repertoire in response to dendritic cell vaccination against melanoma. Oncoimmunology. 2014, 3, e27589. doi 10.4161/onci.27589. [DOI] [PMC free article] [PubMed] [Google Scholar]
Associated Data
This section collects any data citations, data availability statements, or supplementary materials included in this article.