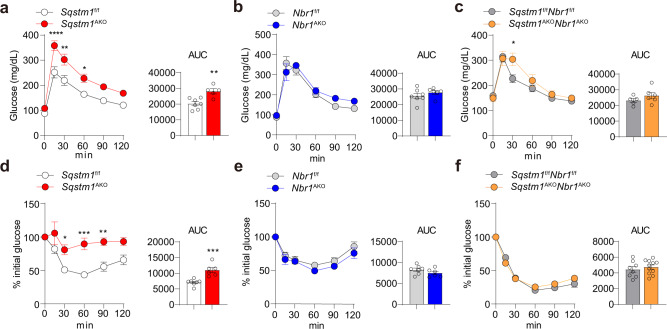
Fig. 3. Role of adipocyte NBR1 in the control of glucose intolerance and insulin resistance.
a–c Glucose tolerance test (GTT) were performed in Sqstm1AKO (a), Nbr1AKO (b), Sqstm1AKONbr1AKO (c) male mice, and their respective controls at 25–28 weeks of age. Sqstm1f/f (n = 7), Sqstm1AKO (n = 5), Nbr1f/f (n = 7), Nbr1AKO (n = 6), Sqstm1f/fNbr1f/f (n = 5), and Sqstm1AKONbr1AKO (n = 6). Longitudinal graph: p < 0.0001, p = 0.002, p = 0.0319 (a), p = 0.0318 (c). Area under curves (AUC) were calculated from GTT. p = 0.0033 (a). d–f Insulin tolerance test (ITT) was performed in Sqstm1AKO (d), Nbr1AKO (e), Sqstm1AKONbr1AKO (f) male mice and their respective controls at 25–28 weeks of age. Results are presented as percent of the initial glucose levels. Sqstm1f/f (n = 7), Sqstm1Ako (n = 6), Nbr1f/f (n = 7), Nbr1AKO (n = 6), Sqstm1f/fNbr1f/f (n = 8), and Sqstm1AKONbr1AKO (n = 11). Longitudinal graph: p = 0.0273, p = 0.0002, p = 0.0035 (d). AUC was calculated from ITT. Data are presented as mean ± SEM (a–f). *p < 0.05, **p < 0.01, ***p < 0.001, ***p < 0.0001. Two-way ANOVA followed by Bonferroni’s post-test (a–f longitudinal graphs). Two-tailed Student’s T-test (a–f AUC bar graphs). Source data are provided as a Source Data file.

