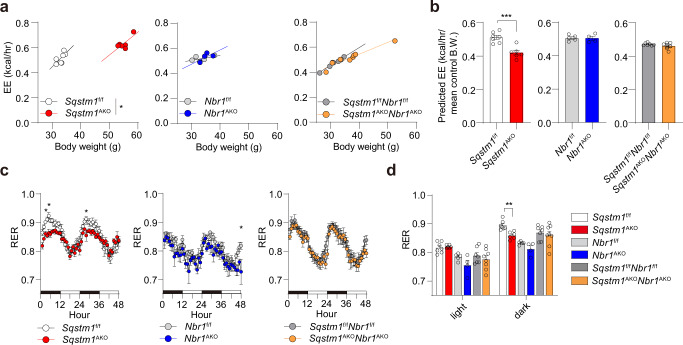
Fig. 4. Role of NBR1 in systemic energy expenditure.
A metabolic characterization of the adipocyte-selective KO mice was performed by using an automated indirect calorimetry system (CLAMS) in male mice at 50–55 weeks of age. Sqstm1f/f (n = 7), Sqstm1AKO (n = 6), Nbr1f/f (n = 5), Nbr1AKO (n = 4), Sqstm1f/fNbr1f/f (n = 7), and Sqstm1AKONbr1AKO (n = 8). a Regression plots of Energy expenditure (EE) against body weight. ANCOVA test using body weight as covariate. p = 0.043 Sqstm1AKO vs Sqstm1f/f. b Predicted energy expenditure at the mean body weight of respective flox control mice. The mean values of body weight are 33.1 g in Sqstm1f/f, 33.46 g in Nbr1f/f, and 31.24 g in Sqstm1f/fNbr1f/f mice. Two-tailed Student’s T-test. p = 0.0004 Sqstm1AKO vs Sqstm1f/f. BW body weight. c Respiratory exchange rate (RER) was recorded and plotted. Two-way ANOVA followed by Bonferroni’s post-test. p = 0.0421 (4 h), p = 0.0196 (5 h), p = 0.0308 (28 h) Sqstm1AKO vs Sqstm1f/f, p = 0.0126 (48 h) Nbr1AKO vs Nbr1f/f. d Quantification of respective AUC from (c) was analyzed by two-tailed Student’s T-test. p = 0.0012 Sqstm1AKO vs Sqstm1f/f. Data are presented as mean ± SEM (b–d). *p < 0.05, **p < 0.01, ***p < 0.001. Source data are provided as a Source Data file.

