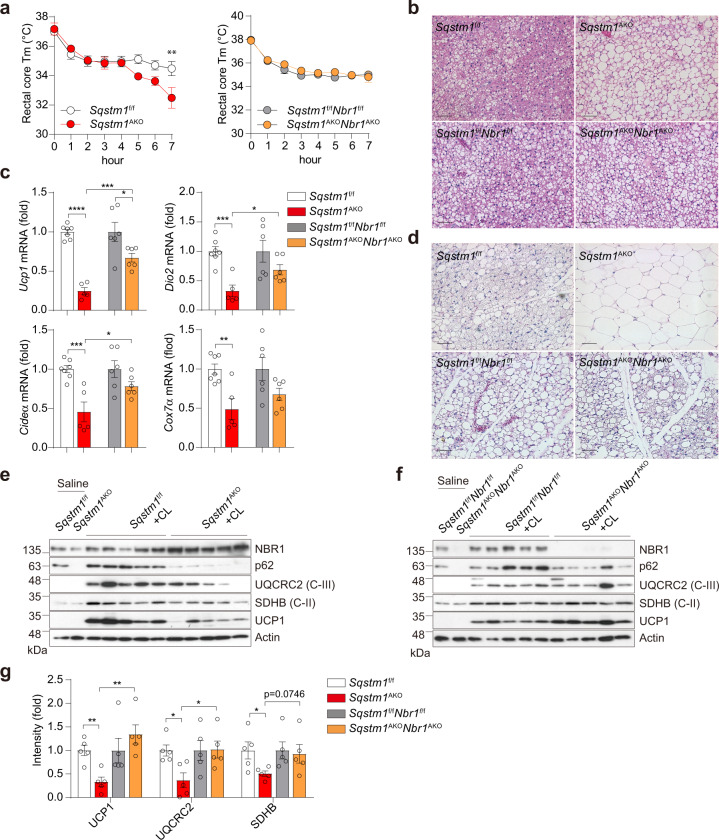
Fig. 5. Role of NBR1 in adaptive thermogenesis in BAT and inguinal WAT.
a–c Male mice at 25 weeks of age were subjected to acute cold exposure (4 °C) for 7 h to stimulate brown thermogenesis. a Rectal core temperature was measured for consecutive 7 h. Sqstm1f/f (n = 10), Sqstm1AKO (n = 6), Sqstm1f/fNbr1f/f (n = 9), and Sqstm1AKONbr1AKO (n = 10). Two-way ANOVA followed by Bonferroni’s post-test. b Representative H&E staining in BAT of indicated mice (n = 3, per genotype). Scale bar = 100 μm. c qPCR analysis of thermogenesis-related genes in BAT of mice. Results are presented as change fold related to individual controls. Sqstm1f/f (n = 7), Sqstm1AKO (n = 5), Sqstm1f/fNbr1f/f (n = 6), and Sqstm1AKONbr1AKO (n = 6). Two-tailed Student’s T-test. d–g Male mice at 25 weeks of age were injected with CL316,243 or saline as control for consecutive 5 days. d Representative H&E staining in iWAT of indicated mice. Sqstm1f/f (n = 4), Sqstm1AKO (n = 4), Sqstm1f/fNbr1f/f (n = 3), and Sqstm1AKONbr1AKO (n = 3). Scale bar = 100 μm. e, f Immunoblot analysis of mitochondrial OXPHOS genes and UCP1 in BAT of Sqstm1AKO (e) and Sqstm1AKONbr1AKO (f) and their respective controls (n = 5, per genotype). g Densitometric quantification of gene intensity from western blot (e, f). Results are presented as change fold related to individual controls. Two-tailed Student’s T-test. Data are presented as mean ± SEM (a, c, g). *p < 0.05, **p < 0.01, ***p < 0.001, ****p < 0.0001. Source data are provided as a Source Data file.

