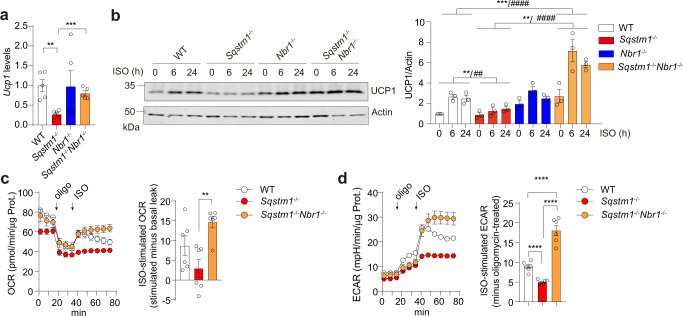
Fig. 6. Role of NBR1 in adaptive thermogenesis in primary brown adipocytes.
a qPCR analysis of Ucp1 expression in primary brown adipocytes differentiated from SVF of four indicated genotypes (n = 5 biological replicates). b Immunoblot analysis of UCP1 in primary brown adipocytes of four indicated genotypes, treated with ISO (0.5 µM) for indicated time. Representative blots (left) and quantification (right) from three independent experiments were shown. c, d Immortalized SVF from WT, Sqstm1–/–, and Sqstm1–/–Nbr1–/– mice were differentiated into brown adipocytes for Seahorse analyses. c Oxygen consumption rate (OCR) were determined (n = 6 biological replicates). Left: plot of OCR to time measured by Seahorse. Right: calculated ISO-stimulated respiration levels after subtracting levels of basal proton leak. d Extracellular acidification rate (ECAR) were measured (n = 6 biological replicates). Left: plot of ECAR to time measured by Seahorse. Right: calculated ISO-stimulated ECAR values after subtracting oligomycin-treated levels. Data are presented as mean ± SEM (a–d). *p < 0.05, **/##p < 0.01, ***p < 0.001, ****/####p < 0.0001. Two-tailed Student’s T-test (a, c, d bar graphs). Two-way ANOVA (b). Source data are provided as a Source Data file.

