
Fig. 4. Comparison of measured coefficients of friction.
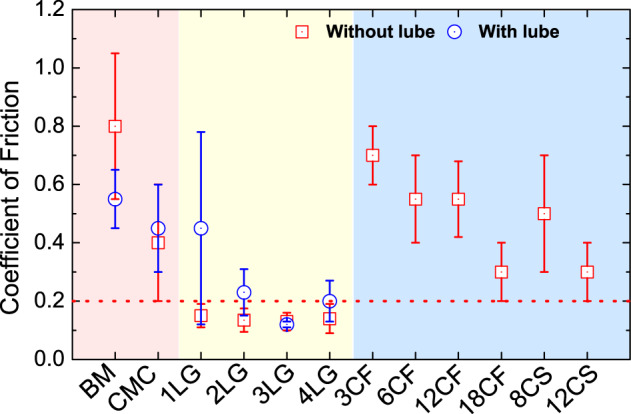
Average COF from measurements in Fig. 3, with and without lubricant, for 1–4LG and all COC reference samples. The red shaded region highlights the bare media and media with a commercial overcoat, the yellow region highlights media with graphene overcoat, and the blue region highlights media with FCVA-ta-C. The horizontal red dashed line is a reference at COF = 0.2. The error bars indicate the spread around the average COF.