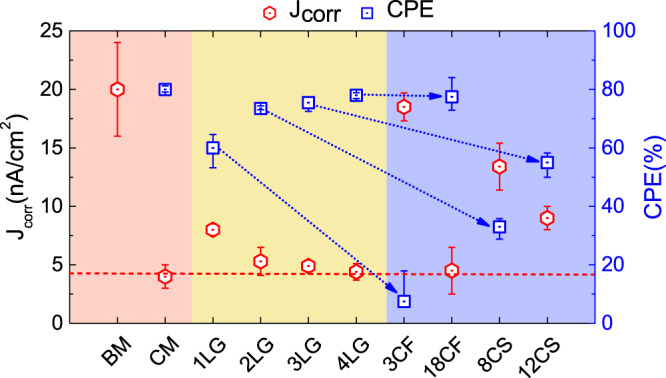
Fig. 8. Corrosion measurements.

Corrosion current density Jcorr and corrosion protection efficiency (CPE) for different samples. The corrosion resistance varies inversely with Jcorr51. 2–4LG have similar CPE to ~2.7 nm CMC and ~1.8 nm COC in sample 18CF. The dotted line is a guide to the eye for Jcorr of different samples. The arrow compares various 1–4LG-COCs pairs, such as 1LG → 3CF, 2LG → 8CS, 3LG → 12CS, and 4LG → 18CF, as the 1–4LG-based sample in each pair is always slightly thinner than the amorphous COC. The red shaded region highlights the bare media and media with a commercial overcoat, the yellow region highlights media with graphene overcoats and the blue region highlights media with FCVA-deposited ta-C. The horizontal red dashed line is a reference at Jcorr = 4 nA/cm2. The error bars stem from taking the average of multiple repeated measurements.
