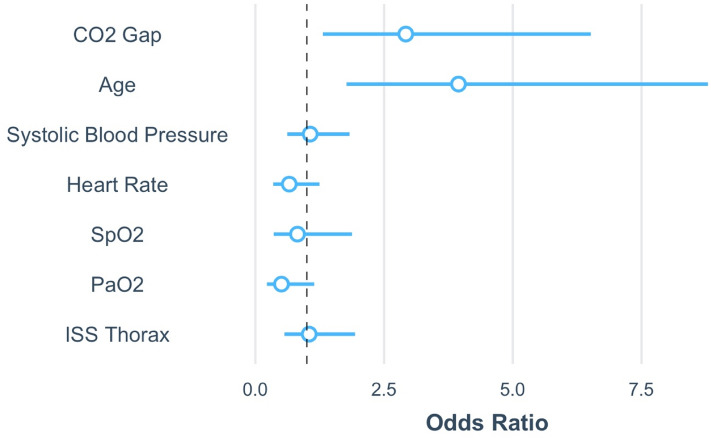
Figure 4.
Scaled regression coefficient of the multivariate logistic regression. Illustration of the multivariate logistic regression model summarized on Table 3. Regression coefficients are exponentiated and scaled. The horizontal lines around the dots indicates the 95% confidence interval of the odds ratio. CO2 gap = PaO2—EtCO2. Figure was created using RStudio (2020). RStudio: Integrated Development for R. RStudio, PBC, Boston, MA URL http://www.rstudio.com/. and the package ggplot2 by Wickham H (2016).

