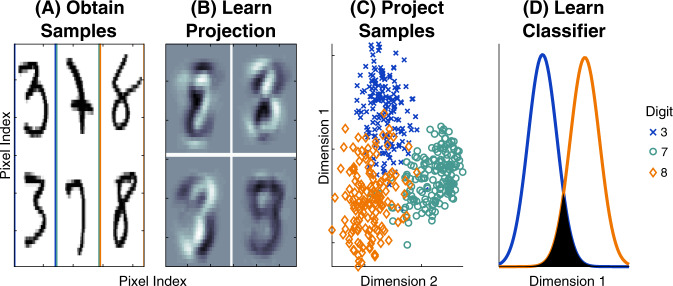
Fig. 4. Schematic illustrating linear optimal low-rank (LOL) as a supervised manifold learning technique.
A 300 training samples of the numbers 3, 7, and 8 from the MNIST dataset (100 samples per digit); each sample is a 28 × 28 = 784 dimensional image (boundary colors are for visualization purposes). B The first four projection matrices learned by LOL. Each is a linear combination of the sample images. C Projecting 500 new (test) samples into the top two learned dimensions; digits color coded as in (A). LOL-projected data from three distinct clusters. D Using the low-dimensional data to learn a classifier. The estimated distributions for 3 and 8 of the test samples (after projecting data into two dimensions and using LDA to classify) demonstrate that 3 and 8 are easily separable by linear methods after LOL projections (the color of the line indicates the digit). The filled area is the estimated error rate; the goal of any classification algorithm is to minimize that area. LOL is performing well on this high-dimensional real data example.

