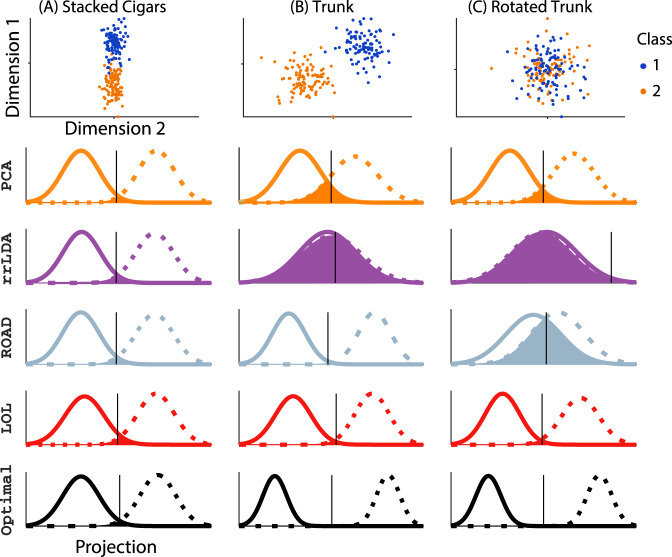
Fig. 5. LOL achieves near-optimal performance for three different multivariate Gaussian distributions, each with 100 samples in 1000 dimensions.
For each approach, we project into the top three dimensions, and then use LDA to classify 10,000 new samples. The six rows show (from top to bottom): Row 1: A scatter plot of the first two dimensions of the sampled points, with class 0 and 1 as orange and blue dots, respectively. The next rows each show the estimated posterior for class 0 and class 1, in solid and dashed lines, respectively. The overlap of the distributions---which quantifies the magnitude of the error---is filled. The black vertical line shows the estimated threshold for each method. The techniques include: PCA; reduced rank LDA(rrLDA), a method that projects onto the top d eigenvectors of sample class-conditional covariance; ROAD, a sparse method designed specifically for this model; LOL, our proposed method; and the Bayes optimal classifier. A Stacked Cigars The mean difference vector is aligned with the direction of maximal variance, and is mostly concentrated in a single dimension, making it ideal for PCA, rrLDA, and sparse methods. In this setting, the results are similar for all methods, and essentially optimal. B Trunk The mean difference vector is orthogonal to the direction of maximal variance; PCA performs worse and rrLDA is at chance, but sparse methods and LOL can still recover the correct dimensions, achieving nearly optimal performance. C Rotated Trunk Same as (B), but the data are rotated; in this case, only LOL performs well. Note that LOL is closest to Bayes optimal in all three settings.

