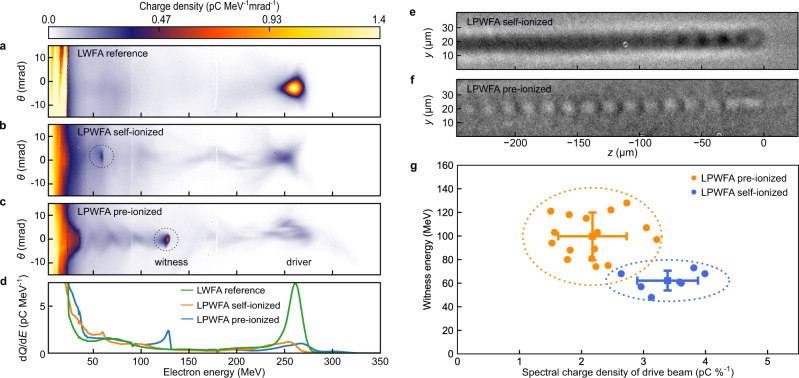
Fig. 2. Representative electron spectra, plasma wave shadowgrams, and statistical analysis of witness beam energy.
a Energy spectrum of LWFA electrons transmitted through the steel foil without operating the PWFA stage, with θ representing the divergence. b LPWFA spectrum without pre-ionizing laser. c LPWFA spectrum with the PWFA stage ionized prior to the drive beam arrival. d Charge distribution integrated over ±6 mrad divergence: green line corresponds to a, orange to b, and blue to c. Additional spectra used for determining the statistical parameters can be found in Supplementary Fig. 3, with the measured drive beam parameters from all shots summarized in Supplementary Table 1. e Plasma wakefield shadowgram at the center of the PWFA stage, with the drive beam propagating to the right and ionizing the gas by means of its electric field (self-ionized case). The ionized channel (dark region) and several plasma wakefield oscillations directly behind the driver are visible. f Corresponding shadowgram of a plasma wakefield in the pre-ionized case. The plasma wave structure is more pronounced and shows more subsequent cavities than in the self-ionized case, indicating a stronger wakefield excitation. g Measured witness energy correlated with the remaining spectral charge density of the drive beam. The data points represent spectra exhibiting clear witness beams in the pre-ionized (orange, 37% of shots) and self-ionized case (blue, 28% of shots). The squares denote the mean value of each set with error bars visualizing the root mean square shot-to-shot fluctuations and ellipses encircling the area of 2 SDs. Operating the LPWFA with pre-ionization results in consistently higher witness beam energy gain together with stronger driver degradation.

