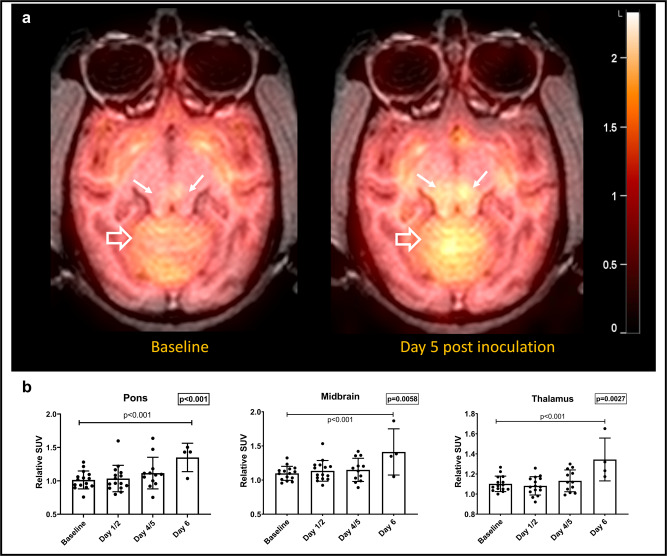
Fig. 3. Longitudinal FDG PET changes in infected monkeys.
a Parametric relative SUV maps from a representative EBOV-infected animal showing increased uptake in the brainstem (solid white arrows) and cerebellum (open white arrows) on Day 5 post inoculation compared to baseline. b Significant increases in relative FDG uptake are seen in the thalamus, midbrain and pons over the course of disease (n = 15 animals, Linear mixed effect model, S-plus 8.2, p = 0.0027, 0.0059 and 0.0007, respectively). Data are presented as mean values + /− SEM. Source data are provided as a Source Data file.

