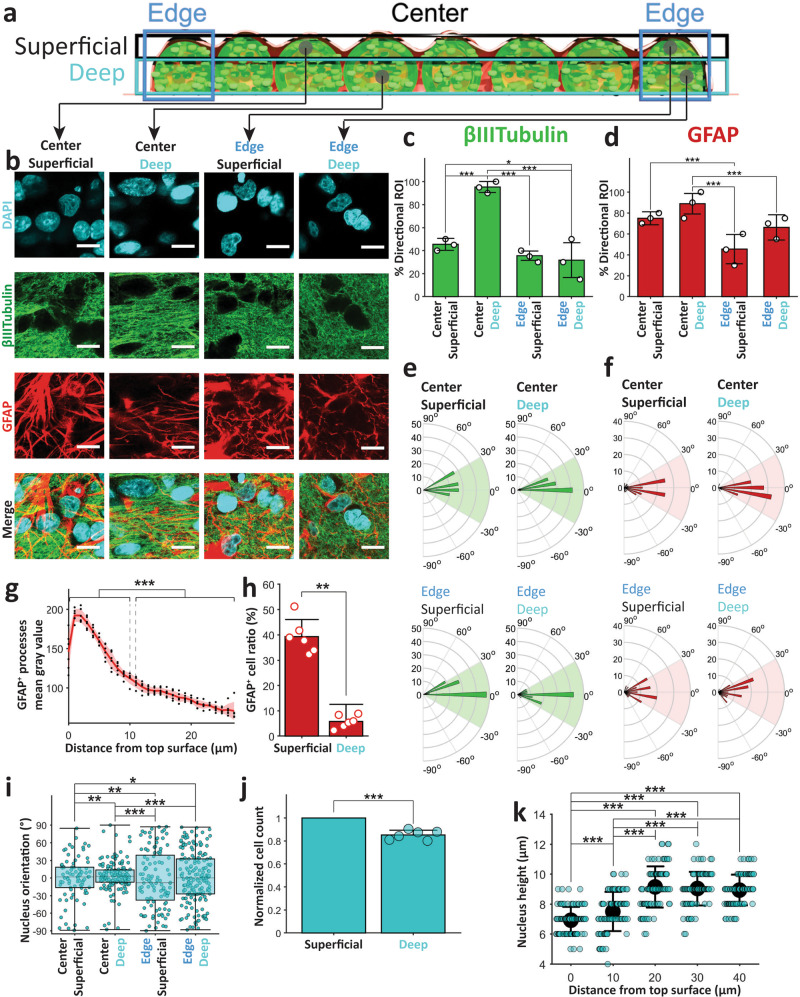
Fig. 3. Processes and nucleus alignment.
a Schematic of a linear 3D culture with edge (blue), superficial layer (black), and deep layer(cyan) marked with rectangles. Sample locations of regions of interest are marked with gray circles. b Regions of interest (ROIs) from confocal z-stack images from culture locations indicated in a (from top bottom: DAPI, βIII-Tubulin, GFAP and merge, scale bar 10 μm). Mean and standard deviation of % of ROIs with directionality (alignment) for βIII-Tubulin (c) and GFAP (d) stained images at locations specified on the x-axis. Polar plot histograms of the directions (−90° to 90° with 5° bin width) found in the ROIs with directionality (c, d) for βIII-Tubulin+ neuronal (e) and GFAP+ astrocytic processes (f) at different locations. Radial lines indicates angles between aligned processes and culture’s long axis, and concentric circles show numbers of ROIs with alignment angle within a bin range. Green (e) and red (f) shaded region shows the ±30° angle range from culture long axis. g Average gray value (black dots) with mean (red thick line), and standard deviation (red shaded area) of GFAP+ processes at different distances (indicated on the x-axis) from top surface at the center of culture. h Means ± standard deviations of the number of GFAP+ cells in the superficial layer (top 10 μm) and deep layer (15–25 μm deep). i Box plot of nucleus (DAPI+ objects) alignment angles at different locations indicated on the x-axis. j Normalized number of DAPI+ objects in superficial layer (top 10 μm) and deep layer (15–25 μm deep) at center locations. k Means (black filled circle) with standard deviations of nucleus bounding cuboid height (along z direction) at different distances from top surface at center locations. Same 60 ROIs for each location from three cultures (20 each) were analyzed for c and d. Among these ROIs, 27, 57, 21, and 19 ROIs showed βIII-Tubulin alignment, and 45, 53, 27, and 40 ROIs showed GFAP alignment at center superficial, center deep, edge superficial, and edge deep locations, respectively. These directional ROIs were analyzed in e and f. For g, h, j, same n = 6 (100 μm × 100 μm) confocal z-stacks (40 μm deep from top surface) from three cultures’ center locations (two each) were analyzed. For k, n = 90 DAPI+ objects for each distance from surface (from three cultures) were analyzed. In total, 30 DAPI+ objects were counted from each culture’s z-plane for each distance from surface in k. Asterisks indicate results of (j) paired-sample t-test and (c, d, i, and k) two-sample Kolmogorov–Smirnov test (*p < 0.05, **p < 0.01, and ***p < 0.001).

