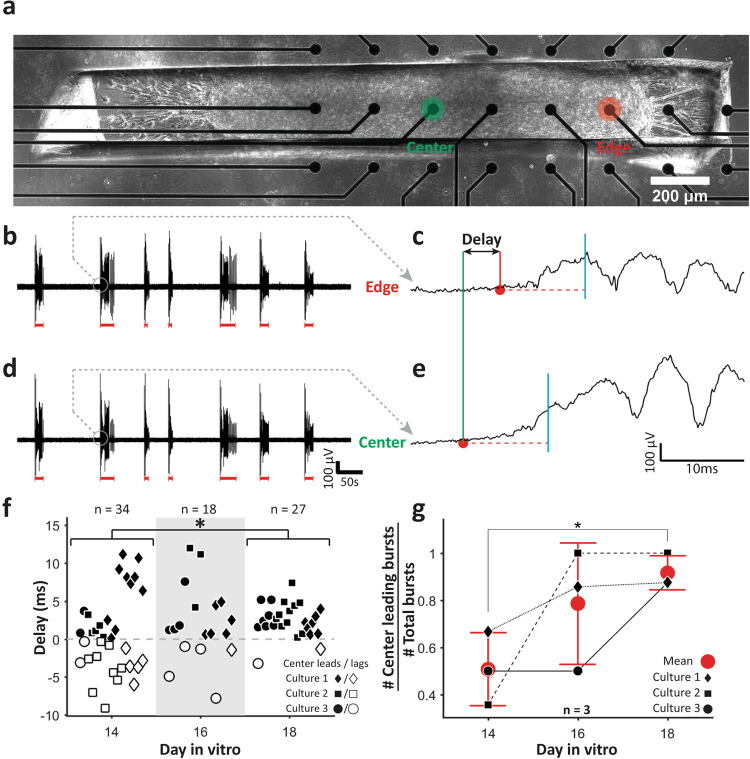
Fig. 5. Local field potential (LFP) analysis.
a Phase contrast image of a 3D linear culture on a multi-electrode array. Active channels at edge (red) and center (green) are marked by text and filled circles. Recorded LFPs from edge (b) and, center (d) electrode with detected bursts indicated by red lines. Zoomed in traces for the same burst (marked by gray circles in b and d from edge (c) and center (e) electrodes, respectively. Red circles indicate bursts’ initiation times. Red horizontal dashed line indicates threshold, cyan vertical line after threshold line indicates the time point (10 ms after trace crosses threshold) until which the trace must remain above threshold (red dashed line) for the initiation time to be registered. f Beeswarm plots of delays between burst initiations at edge and at center on different DIVs. Black filled and white filled shapes indicate that burst first initiated at the center or at the edge, respectively. g Mean ± standard deviation of the ratio of bursts initiating at the center (center leading bursts) and total detected bursts on different DIVs. Three cultures were recorded for all panels. For f and g, asterisks indicate results of two-sample Kolmogorov–Smirnov test (*p < 0.05, **p < 0.01, and ***p < 0.001).

