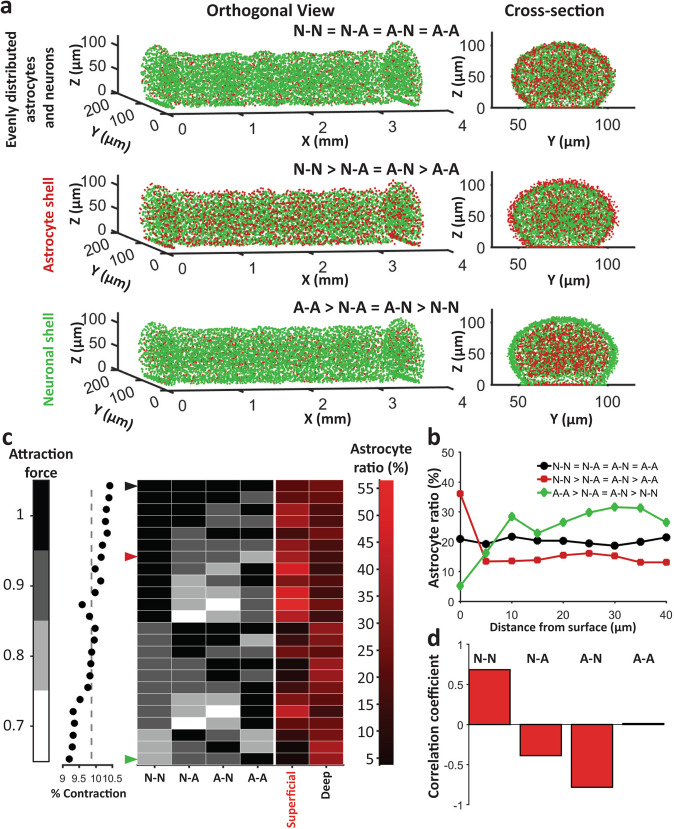
Fig. 7. Simulated outcome of different attraction force configurations.
a Orthogonal view (left) and cross section view (right) of three sample configurations: top: N-N = N-A = A-N = A-A configuration yielded uniformly distributed neurons and astrocytes, middle: N-N > N-A = A-N > A-A yielded astrocyte shell, bottom: A-A > A-N > N-A > N-N yielded neuronal shell. b Mean astrocyte to total cell ratio at different distance from surface for the three configurations in a. c % contraction (left, dot plot), Astrocyte ratio (right: shades of red) at surface and maximum astrocyte ratio in deep layers (more than 10 μm below surface) for different relative cell attraction constants (indicated by shades of black). Arrows indicate the cases shown in a and b. d Correlation coefficients between values of different adhesive forces and astrocyte ratio in the superficial layer.

