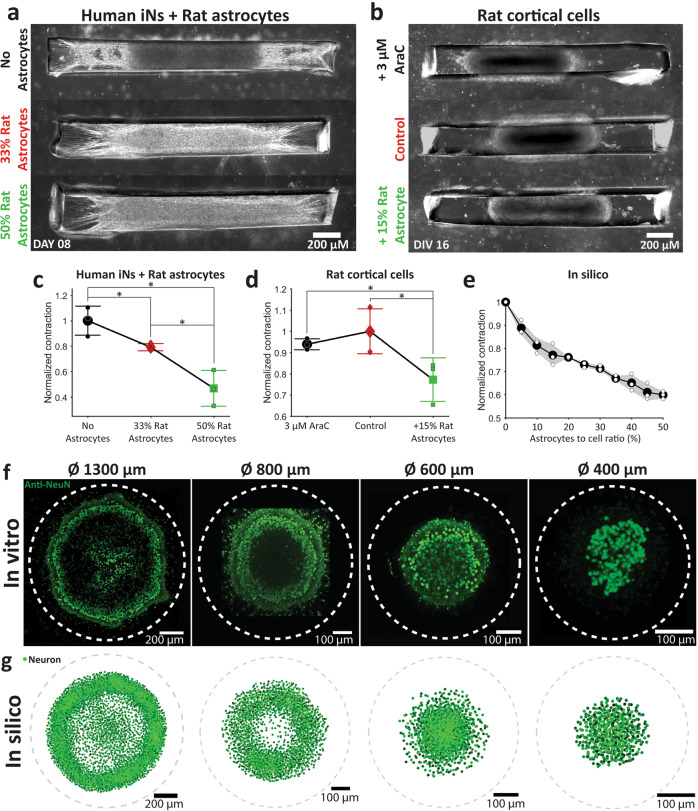
Fig. 8. In silico model validation.
a Human iNs cultures with top: no astrocyte, middle: 33% rat astrocytes and bottom: 50% rat astrocytes added. b Rat cultures top: chronically cultured in 3 μM AraC, middle: control, bottom: +15% astrocyte added. Mean with standard deviation of normalized contraction for different conditions in c Human iNs + rat astrocyte cultures, d Rat cortical cell cultures, and e in silico culture. Normalization was done first, with respect to culture size on the day 0 and then with respect to c mean of 0% astrocyte culture, d mean of control, e mean of 0% astrocyte culture contraction. Three cultures were analyzed for each condition of each type of culture. Asterisks indicate results of two-sample Kolmogorov–Smirnov test (*p < 0.05, **p < 0.01, and ***p < 0.001). f Projection of brightest points of all the confocal z-stacks of Anti-NeuN staining of (from left to right) 1300, 800, 600, and 400 μm diameter rat cortical cell cultures. Dashed lines indicate confinement. g In silico simulation results for confinement diameter (from left to right) 1300, 800, 600, and 400 μm.

