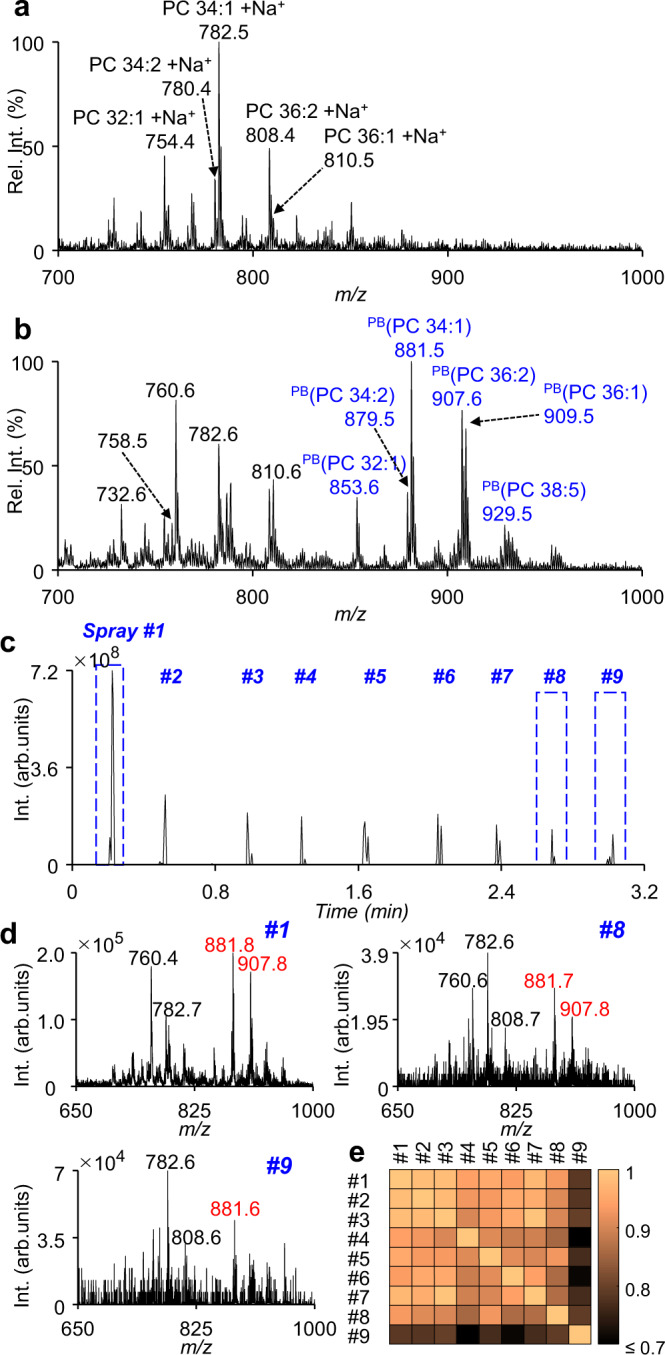
Fig. 2. MS spectrum of a single MDA-MB-231 cell.

a, b MS spectra of lipids from a single MDA-MB-231cell without (a) and with (b) photochemical derivatization (the m/z values in blue: PB products of lipids). c Total ion chromatogram (TIC) of a single MDA-MB-231 cell sampled 9 times by on-demand DAESI-MS after cell fixation and photochemical derivatization. d Average MS spectra of the 1st, 8th, and 9th samplings (the m/z values in red: PB products of lipids). e Pairwise correlation coefficients calculated using the intensities of PB product ions of each spray. Source data are provided in a Source Data file.
