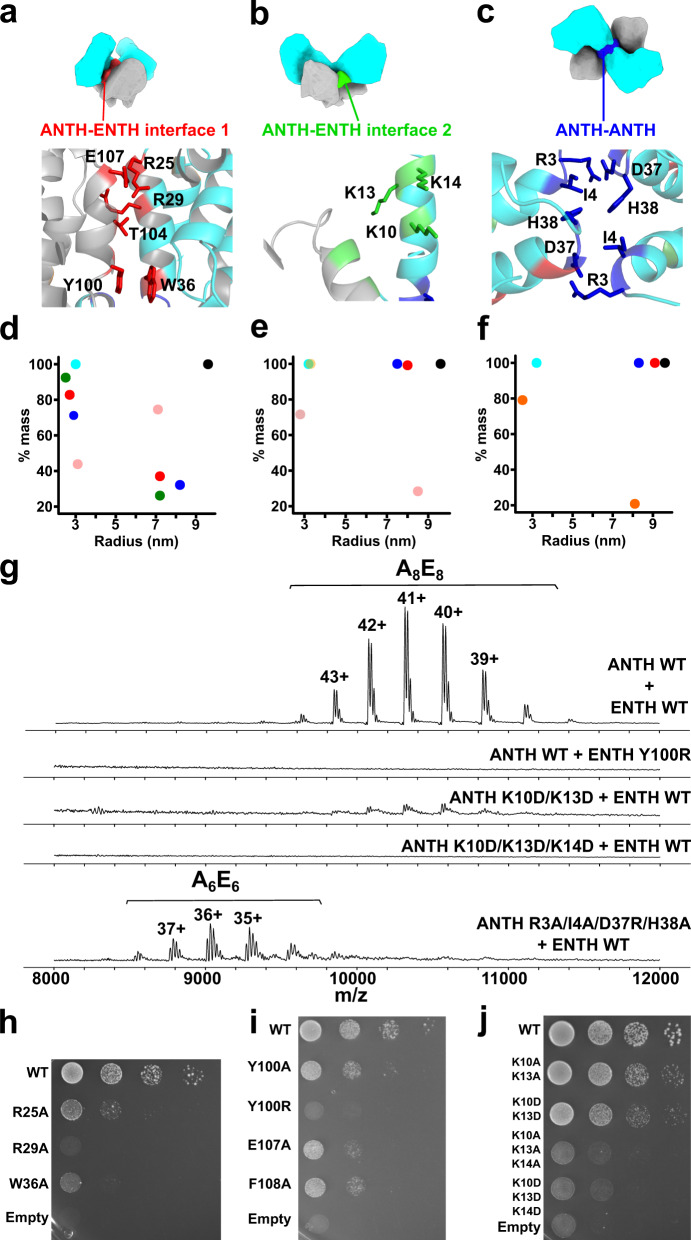
Fig. 4. Different interfaces present in the AENTH tetramer.
a–c Schematic representation of the AENTH model showing the different interfaces present, designated as ANTH-ENTH interface 1 (a), ANTH-ENTH interface 2 (b), and ANTH-ANTH interface (c). In the lower panels, the residues involved in each of the interfaces are shown in stick representation and colored using the color scheme for each of the interfaces. (d–f) Intensity mass plot from DLS data showing the hydrodynamic radius of particles in solution for wild type AENTH (black) and different mutants. As a reference, the ANTH domain is shown in cyan (see Supplementary Table 1 for DLS parameters). d ANTH-ENTH interface 1 showing mutations ANTH Y100R (red) ANTH R25A (blue), ANTH R29A (green) and ENTH E107A (pink); (e) ANTH-ENTH interface 2 with mutations ANTH K10A/K13A/K14A (pink) ANTH K10D/K13D/K14D (yellow), ENTH E54A/D57A/D60A (blue) and ANTH Q9A/K10A (red). (f) ANTH-ANTH interface with mutations ANTH R3A (orange), ANTH R3A/I4A/D37R/H38A (blue), and ANTH R3A/I4A/D37R (red). g Summary of the native mass spectrometry results obtained for the mutants of the tetramer interfaces. h–j Growth defects of mutants of ANTH (h) and ENTH (i) ANTH-ENTH interface 1 and ANTH-ENTH interface 2. (j) Interface mutants were expressed after depletion or deletion of endogenous Ent1 and Sla2 proteins, respectively. Cell growth was analyzed after plating a 10-fold serial dilution of cells on SD-Ura plates and incubation for 3 days at 37 °C.

