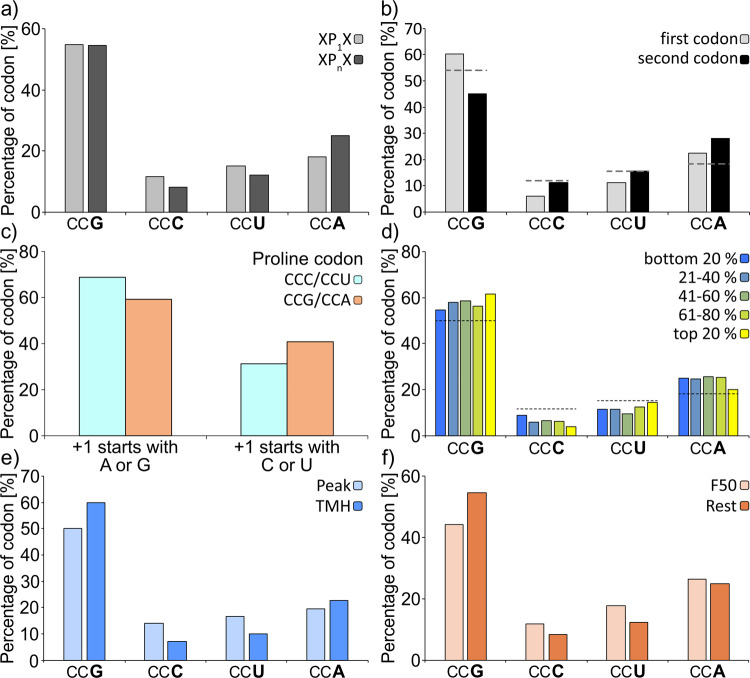
Fig. 2. Bioinformatic analysis of proline codon bias in E. coli.
a Codon usage of either single (XP1X) or consecutive (XPnX) prolines (with X being any amino acid except proline and n > 1). p value = 1.7e−30, chi-squared test. b Codon usage of the first and second proline in PP-motifs. Only PP-motifs with two consecutive proline residues were included in this analysis. The dashed lines indicate the codon usage for single prolines. p value < 2.2e−16, chi-squared test. c Codon usage for amino acids in the +1-position downstream CCC/CCU (cyan) or CCG/CCA (orange) encoded single prolines. p value < 2.2e−16, chi-squared test. d Correlation between proline codon usage in PP-motifs and translation efficiency from least efficiently translated proteins (dark blue) to most efficiently translated proteins (yellow). The dashed lines indicate the codon usage for single prolines. e Difference between proline codon usage of PP-motifs in the peak region (light blue, amino acids 49–59 from the TMH start where PP-motifs are enriched to facilitate the efficient insertion of TMH into the membrane) and TMHs (blue; transmembrane helices in which PP-motifs are depleted for proper folding of transmembrane segments11. p value = 0.13, chi-squared test. f Proline codon usage in PP-motifs in the first 50 codons (light orange) compared with the rest of proteins (orange). p value = 2.14e−7, chi-squared test.

