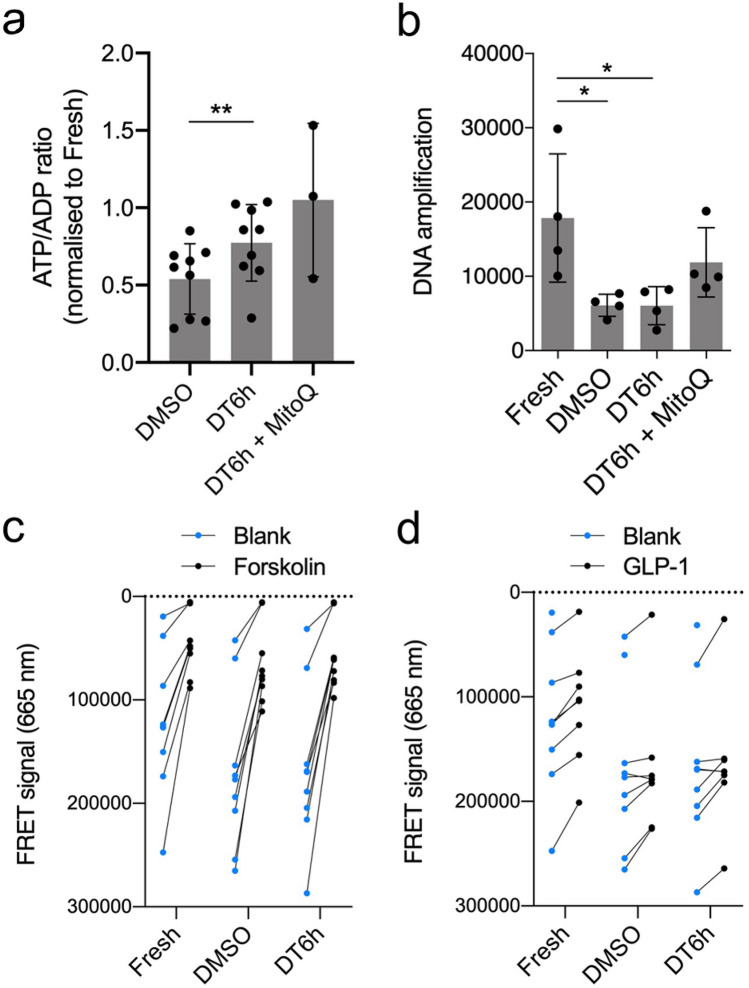
Figure 5.
Metabolic data for islets cryopreserved using the proposed protocol (DT6h). (a) ATP/ADP ratio of cryopreserved islets 24 h post-thaw normalised to ATP/ADP ratio in fresh islets (n = 9 islet isolations). (b) Mitochondrial DNA oxidation levels in fresh, DMSO-cryopreserved and DT6h-cryopreserved islets. Higher amplification numbers indicate lower oxidation of mitochondrial DNA (n = 4 islet isolations). (c) Cyclic AMP (cAMP) production in fresh, DMSO-cryopreserved and DT6h-cryopreserved islets upon exposure to forskolin or (d) GLP-1. Data in (c) and (d) shown as raw values of the fluorescence resonance energy transfer (FRET) signal at 665 nm, which is inversely proportional to the cAMP concentration in the samples. Data obtained from the same islet sample are connected with a line (n = 8–9 islet isolations). Missing data were below the detection level of the assay. Repeated measures one-way ANOVA followed with Tukey’s HSD post-hoc test was performed, statistically significant differences are marked by asterisks: *p ≤ 0.05, **p ≤ 0.01. All figures were produced using GraphPad Prism (version 8.4.1, https://www.graphpad.com).

