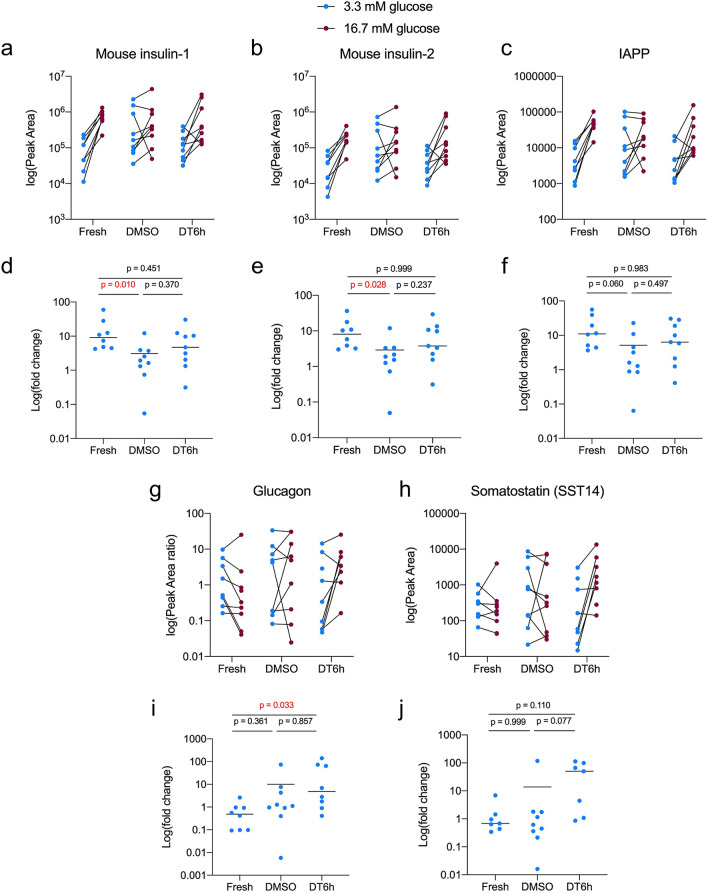
Figure 6.
Peptide production by islets after glucose stimulation. Peptide levels measured by LC–MS/MS for (a) mouse insulin-1, (b) mouse insulin-2 and (c) islet amyloid polypeptide (IAPP). Fold changes calculated as the ratio of Peak Area measured in 16.7 mM glucose and in 3.3 mM glucose for (d) mouse insulin-1, (e) mouse insulin-2, (f) islet amyloid polypeptide (IAPP). Peptide levels measured by LC–MS/MS for (g) glucagon and (h) somatostatin (SST-14). Fold changes calculated as the ratio of Peak Area concentration measured in 16.7 mM glucose and in 3.3 mM glucose for (i) glucagon and (j) somatostatin (SST-14). Peak Areas for glucagon were normalised to Peak Areas for glucagon internal standard. One-way Kruskal–Wallis analysis of variance was performed for the fold changes followed by Dunn’s correction for multiple comparisons (n = 9 samples from 3 isolations, each sample = 10 islets; p-values are shown for each comparison, significant differences are highlighted in red). All figures were produced in GraphPad Prism (version 8.4.1, https://www.graphpad.com).

