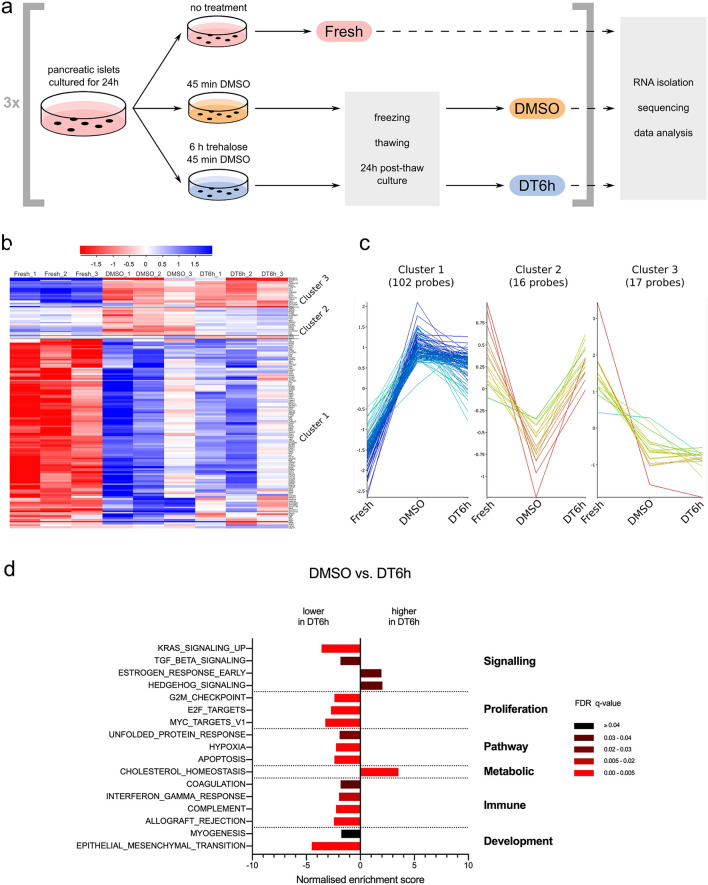
Figure 7.
Impact of cryopreservation on islet transcriptome. (a) Schematic representation of the experimental design. Islets from three separate isolations (n = 3) were used as shown and samples were stored in RNAlater solution. RNA from all samples was processed and sequenced on the same occasion. (b) Heatmap showing the 142 genes that are differentially expressed between the three tested conditions (genes common to both the DESeq2 and Intensity Difference analysis, FDR ≤ 0.05, n = 3 islet isolations, individual replicates shown), clustered based on the hierarchical cluster analysis. (c) Line graph representation of the gene clusters 1, 2 and 3, re-plotted from (b). (d) Preranked Gene Set Enrichment Analysis (GSEA-Preranked) of relative differences in Hallmark gene set expression levels between DMSO- and DT6h-cryopreserved islets (differences of FDR ≤ 0.05 are shown). The gene sets are grouped according to the Process Categories of the Molecular Signatures Database Hallmark Gene Sets (see “Methods”). FDR q-values are highlighted in different shades of red. Figure (a) was created using Inkscape (version 0.91, http://www.inkscape.org/), figures (b) and (c) using SeqMonk39 (version 1.45.4) and figure (d) using GraphPad Prism (version 8.4.1, https://www.graphpad.com).

