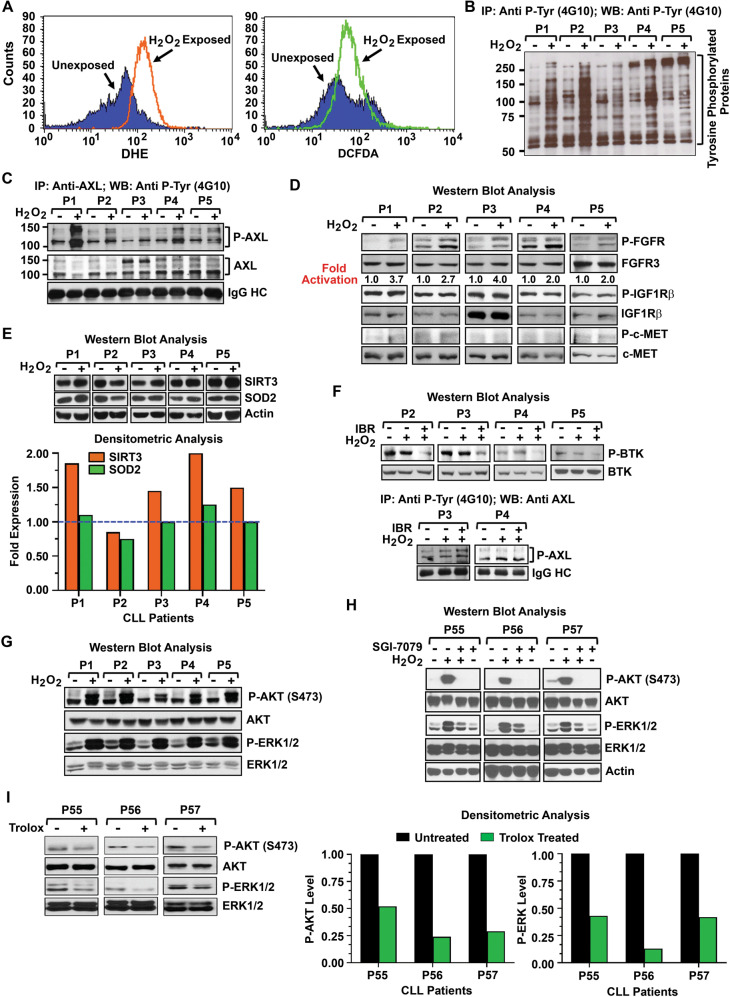
Fig. 5. Induction of ROS activates AXL signaling axis in CLL cells.
A In vitro generation of ROS in CLL cells. Purified CLL cells were exposed to H2O2 (0.6 mM) for 5 min or left untreated. Cells were analyzed for ROS generation by flow cytometry after staining the cells with DHE to detect O2− generation or DCFDA to detect H2O2 accumulation. Results of ROS accumulation in CLL cells from a representative CLL patient is shown. B ROS generation increases tyrosine phosphorylation levels. Purified CLL cells (n = 5; P1–P5) treated with H2O2 as described above were lysed and tyrosine-phosphorylated proteins were immunoprecipitated from the cell lysates using a phospho-tyrosine (4G10) antibody, followed by western blot analysis using the same antibody. C Enforced induction of ROS activates AXL. CLL cell lysates (P1–P5) used in panel B were analyzed to detect AXL phosphorylation levels by immunoprecipitating AXL, followed by western blot using 4G10. The blot was stripped and reprobed with an antibody to AXL. IgG heavy chain (HC) was used as loading control. D Impact of ROS accumulation on other RTKs. CLL cell lysates (P1–P5) used in panels B, C were further analyzed to detect the activation status of multiple RTKs including FGFR (a downstream target of AXL), IGF1Rβ and c-MET in western blots using phospho-specific antibodies. Respective blots were stripped and probed with a specific antibody to FGFR3, IGF1Rβ, or c-MET, and used as loading controls. Densitometric analysis was performed to detect “fold activation” of FGFR (P-FGFR: FGFR3). E Status of SIRT3 and SOD2 expression in H2O2-exposed CLL cells. The above CLL cell lysates were further analyzed for the expression of SIRT3 and SOD2 in western blots using specific antibodies. Actin was used as loading control. Densitometric analyses were performed to determine the expression levels of SIRT3 (SIRT3: actin) and SOD2 (SOD2: actin), and presented as “fold-expression” relative to the basal level the value of which was arbitrarily taken as “1”. The dotted line indicates basal levels (bottom panel). F Enforced induction of ROS does not activate BCR signal. Purified CLL cells used above (P2–P5) were treated with ibrutinib (0.75 µM) for 1 h prior exposing the cells to H2O2 as described above for 5 min or left untreated/unexposed. Cell lysates were analyzed for the activation of BTK (as an indicator for BCR signal activation) in western blots. The blots were stripped, probed for BTK and used as loading control. Further, phospho-tyrosine proteins were immunoprecipitated from the above cell lysates (P3, P4), followed by western blot analysis to detect activation of AXL using a specific antibody. IgG HC was used as loading control (bottom panel). G Impact of ROS-mediated AXL activation on its downstream signal mediators. Finally, H2O2-treated CLL cell lysates (P1–P5) used above (B–E) were assessed for the activation status of AXL downstream targets, AKT and ERK1/2, in western blots using phospho-specific antibodies. The blots were stripped and reprobed to detect total AKT or ERK1/2. H Targeting AXL inhibits ROS-induced activation of AKT/ERK1/2. Purified CLL cells (P55–P57) pretreated with an AXL-inhibitor SGI-7079 at a sublethal dose or left untreated were exposed to H2O2 for 5 min. Cell lysates were examined for the activation status of AKT and ERK1/2 in western blots using specific antibodies. The blots were stripped and reprobed to detect total AKT or ERK1/2. Actin was also used as loading control. I Inhibition of endogenous ROS reduces phosphorylation levels of AKT/ERK1/2. Purified CLL cells (P55–P57) were treated with a ROS-inhibitor, Trolox for 4 h. Cell lysates were analyzed for the activation status of AXL downstream signal mediators, AKT and ERK1/2, in western blots using specific antibodies. The blots were stripped and reprobed to detect total AKT or ERK1/2. Densitometric analyses were performed to assess modulation of AKT (P-AKT: AKT) or ERK1/2 (P-ERK1/2: ERK1/2) activation in Trolox treated vs. untreated CLL cells and presented as bar diagrams (right panels). For each sample, the basal level activation was arbitrarily taken as “1”.

