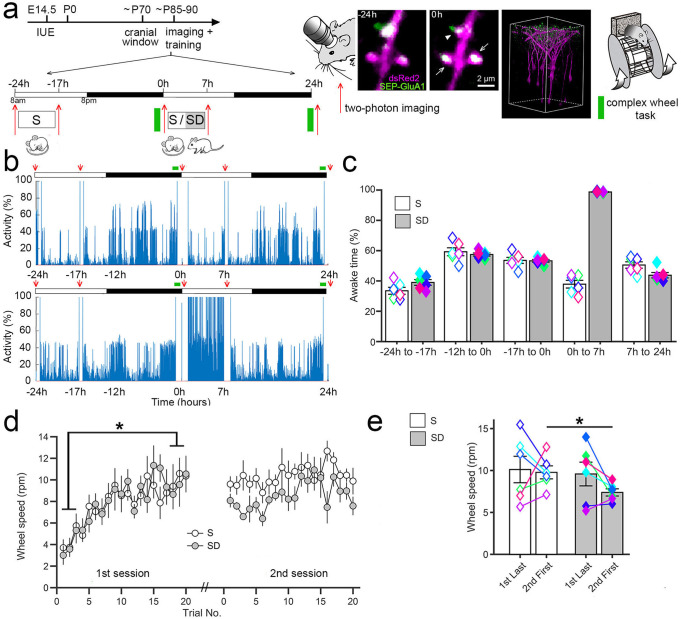
Fig. 1. Sleep/waking behavior and motor learning.
a Left, experimental design. White and black bars indicate the light and dark periods, respectively. IUE, in utero electroporation. E and P indicate embryonic and postnatal age, respectively, in days. S, sleep; SD, sleep deprivation. Right, representative examples of time-lapse in vivo two-photon images of layer 2/3 pyramidal cell apical dendrites, representative 3D reconstruction showing sparse labeling in layer 2/3 (X, Y = 200 μm, Z = 300 μm; 12 mice in total), and schematic of the complex wheel used for motor training. SEP-GluA1 (green), dsRed2 (red), overlap (white). b Representative examples of rest/activity patterns in one S and one SD mouse during the 2 consecutive days when repeated two-photon imaging and motor training occurred (red arrows). c Time spent awake (% of total time; mean ± SEM; 6 S, 6 SD mice) during the indicated time intervals (−24 h to −17 h = 36.3 ± 1.7; −12 h to −0 h = 61.7 ± 1.3; −17 h to −0 h = 56.8 ± 1.0; 0 h to 7 h, S mice = 37.9 ± 2.8; SD mice = 98.7 ± 0.2; 7 h to 24 h, S mice = 50.5 ± 2.3; SD mice = 43.8 ± 2.0). Colored symbols indicate individual animals. d Performance in the complex wheel task for each trial, averaged (± SEM) across the 6 mice of each group. Performance in the first session (first 3 trials vs. last 3 trials): *, two-sided paired t test, p = 0.0004 (n = 12 mice). e Offline consolidation measured by comparing the first 3 trials of session 2 between S and SD mice (mean ± SEM); *, two-sided Student’s t test, p = 0.0236. Colored symbols indicate individual animals. Source data are provided as a Source data file.

