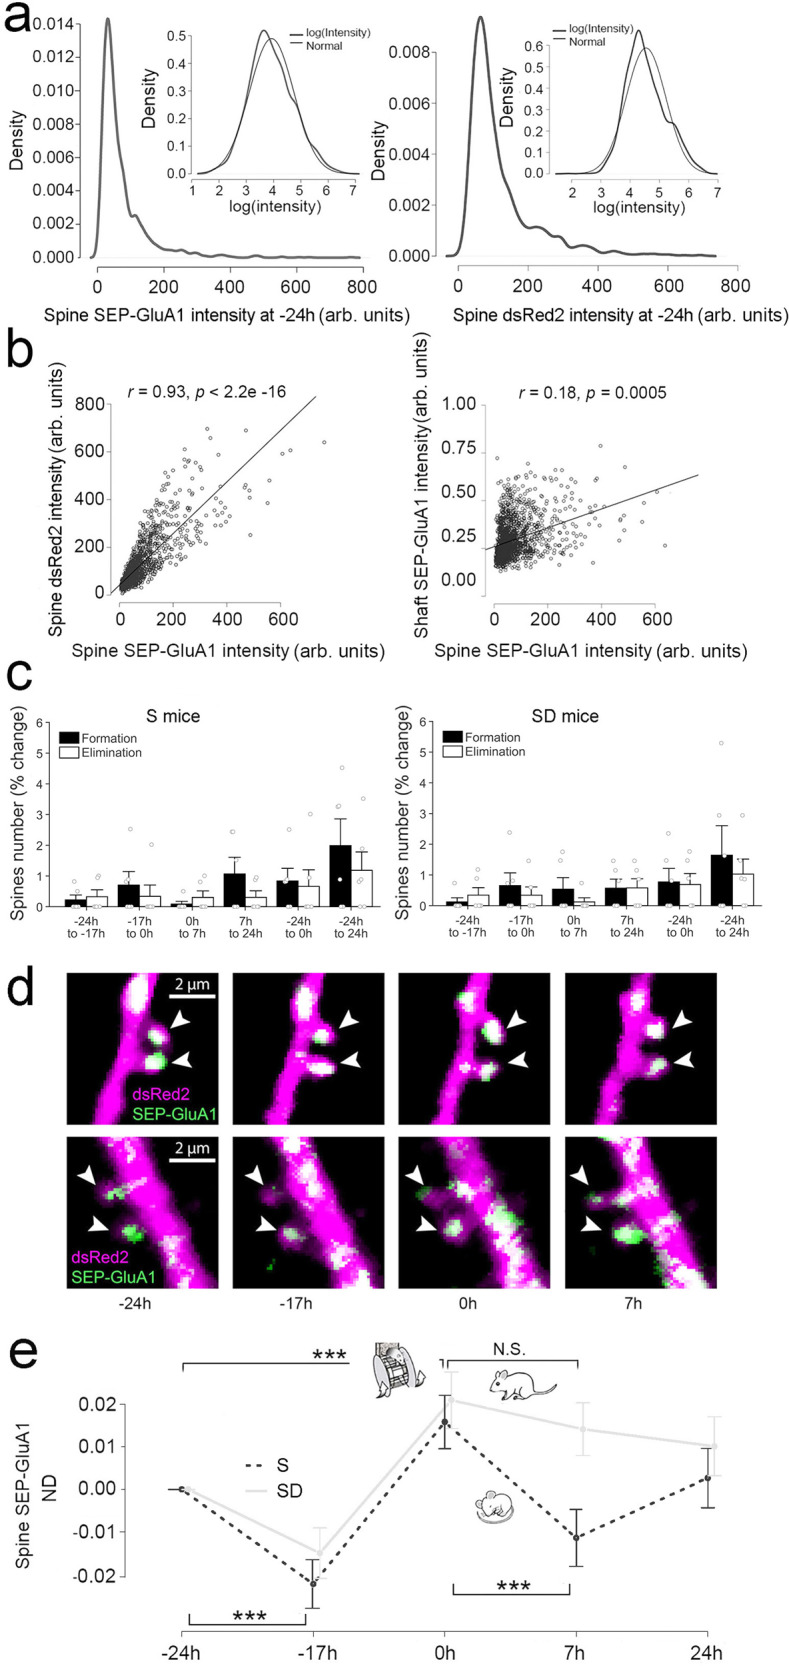
Fig. 2. Mean changes in spine number and spine-surface expression of GluA1 after sleep/waking and motor training.

a Log-normal distributions of the intensities of spine SEP-GluA1 (left) and spine dsRed2 (right) before sleep (−24 h; 12 mice; 1530 spines; 104–192 spines/mouse). Insets, same on a log scale. SEP-GluA1 and dsRed2 intensities were calculated as detailed in Supplementary Fig. 2. b Correlations between the intensities of spine SEP-GluA1 and spine dsRed2 (r = 0.93, p < 2.2e−16) or shaft SEP-GluA1 (r = 0.18, p = 0.0005) before sleep (−24 h). arb. units = arbitrary units. Mean correlation per mouse, significance tested using two-sided one-sample t test. c Spines newly formed and eliminated during the indicated time intervals (mean ± SEM). White circles indicate individual mice (6 S mice, 6 SD mice). S, sleep; SD, sleep deprivation. d Two representative examples (from 12 mice in total) of repeated in vivo two-photon imaging of layer 2/3 pyramidal cell apical dendrites and their spines (arrowheads). SEP-GluA1 (green), dsRed2 (red), overlap (white). e Normalized difference (ND, mean ± SEM) of spine SEP-GluA1 expression relative to −24 h (12 mice; 1530 spines). We show ND instead of the SEP-GluA1 expression because these are the relevant error bars for statistical testing. Two-sided likelihood ratio test followed by two-sided post-hoc comparisons: pre-learning sleep ***p = 0.00003 (n = 12); motor learning ***p = 0.00004 (n = 12); post-learning sleep ***p < 2.2e−6 (n = 6); post-learning sleep deprivation, p = 0.202 (n = 6). Source data are provided as a Source data file.
