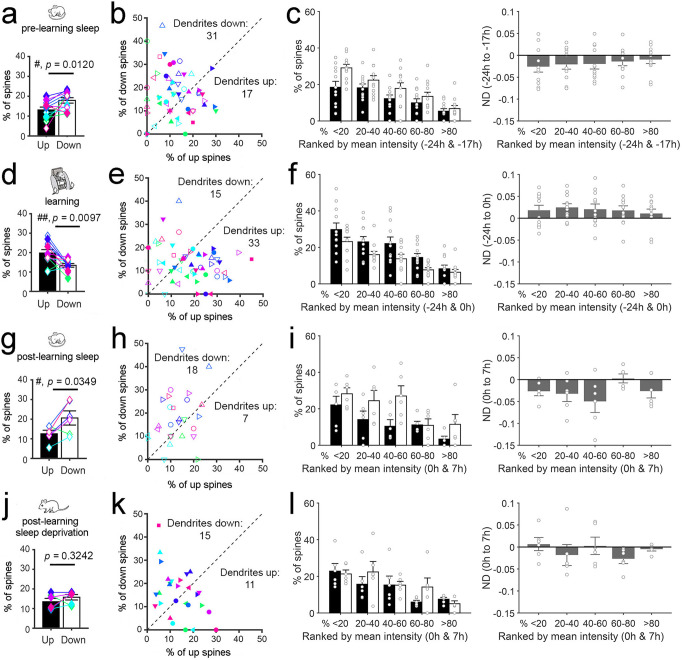
Fig. 3. Single spine analysis of changes in SEP-GluA1 expression after sleep/wake and motor training.
a, b Percentage of up (ND > 0.15) and down (ND < −0.15) spines (a) and up and down dendrites (b) after pre-learning sleep. In a colored symbols indicate individual animals (n = 12 mice; mean ± SEM). c Left, percentage of up spines (black bars) and down spines (white bars) in each quintile; right, ND (normalized difference; mean ± SEM) in spine SEP-GluA1 expression in each quintile. Spines were subdivided in quintiles and ranked in strength based on the mean SEP-GluA1 expression of the two time points indicated on the x axis. White circles indicate individual animals (n = 12 mice). d–f Same as (a–c) for motor learning (n = 12 mice). g–i Same as (a–c) for post-learning sleep (n = 6 mice). j–l Same as (a–c) for post-learning sleep deprivation (n = 6 mice). In a, d, g, j the p values are computed using a two-sided paired sample t test. In b, e, h, k the percentage of up/same/down spines in each dendritic branch is as follows (mean ± std, in %): pre-learning sleep (−24 h to −17 h, all mice): up 12.3 ± 8.16, same 70.3 ± 12.2, down 17.4 ± 9.9; learning (−24 h to 0 h, all mice): up 17.9 ± 10.9, same 68.7 ± 11.9, down 13.4 ± 7.62; post-learning sleep (0 h to 7 h, 6 mice): up 12.4 ± 6.7, same 68.7 ± 15.4, down 18.9 ± 12.3; post-learning SD (0 h to 7 h, 6 mice): up 13.8 ± 7.31, same 70.5 ± 9.7, down 15.7 ± 10.4. Source data are provided as a Source data file.

