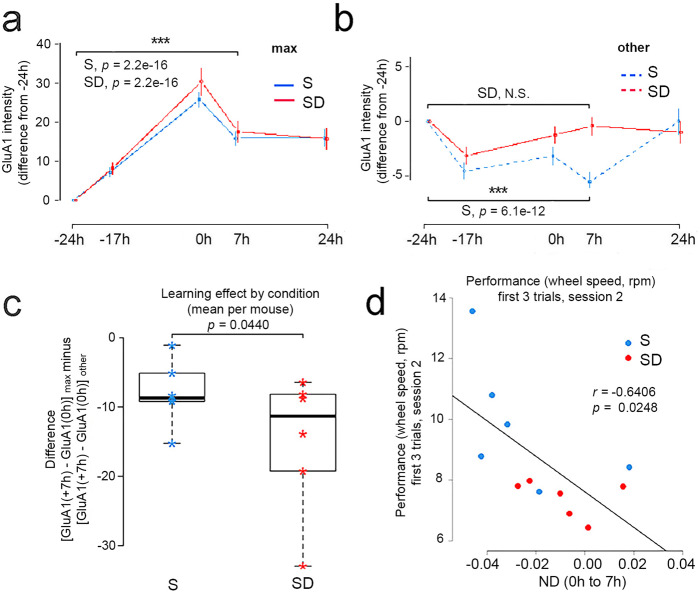
Fig. 4. Post-training changes in max and other spines.
a SEP-GluA1 intensity in max spines (difference from −24 h) across all time points (mean ± SEM). The max spines are defined as those that showed the largest increase from −24 h to 0 h (max spines as % of all spines = 13.5 ± 4.1%, 207/1530; mean ± sd; range per mouse = 6.3–20%; see also Supplementary Fig. 6). These spines maintain high SEP-GluA1 levels at later times (7 h vs −24 h; p = 2.2e−16 in both groups). S, sleep (n = 6 mice); SD, sleep deprivation (n = 6 mice). b SEP-GluA1 intensity in the other spines (difference from −24 h) across all time points (mean ± SEM). Note the different scale of the Y axes in (a, b). During the 7 h after the first training session, the other spines of S mice show a decrease at 7 h vs −24 h (p = 6.1e−12), while the other spines of SD mice do not (7 h vs −24 h, N.S.). In a, b statistical analysis was performed using linear mixed effect models, with session as a categorical fixed effect, and spine, dendrite and mouse as random effects. A likelihood ratio test was used to check for an effect of session. S, sleep (6 mice); SD, sleep deprivation (6 mice). c The difference between the change in SEP-GluA1 from 0 h to 7 h in the max spines and the change in SEP-GluA1 from 0 h to 7 h in all other spines. There is a significant effect of group (S or SD; likelihood ratio test, p = 0.0440), indicating an advantage for the max spines and a penalization of all other spines in the S group (6 mice) relative to the SD group (6 mice). Center line indicates the median, the box boundaries indicate the first and third quartiles and the whiskers indicate the minimum and maximum values. d Negative correlation between performance at the onset of session 2 (first 3 trials) and ND (normalized difference; mean ± SEM) in spine SEP-GluA1 expression in each mouse between 7 h (after S or SD) and 0 h (after training). All spines (r = −0.6406; two-sided Fisher’s z transformation, p = 0.0248). Negative ND values (net decrease in SEP-GluA1 expression) are associated with better performance. S, sleep (6 mice); SD, sleep deprivation (6 mice). Rpm, revolutions per minute. Source data are provided as a Source data file.

