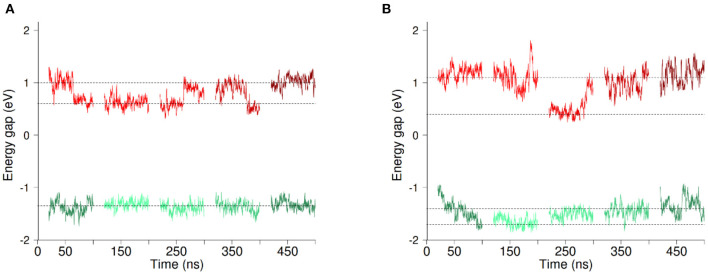
Figure 3.
Evolution of the vertical energy gap ΔE (Ef−Ei) along MD simulations with O2 (A) and without O2 (B). Each line section represents 80ns of MD simulation. The first three sections correspond to parts of the 300ns-long simulation (Set 1–3) while the two last sections come from the two independent 100ns-long replica simulations (Set 4 and 5). Energy gaps computed based on simulations in the initial (resp. final) redox state are shown in red (resp.green). Data shown correspond to running averages of ΔE for clarity. Horizontal lines are guides to the eye.

