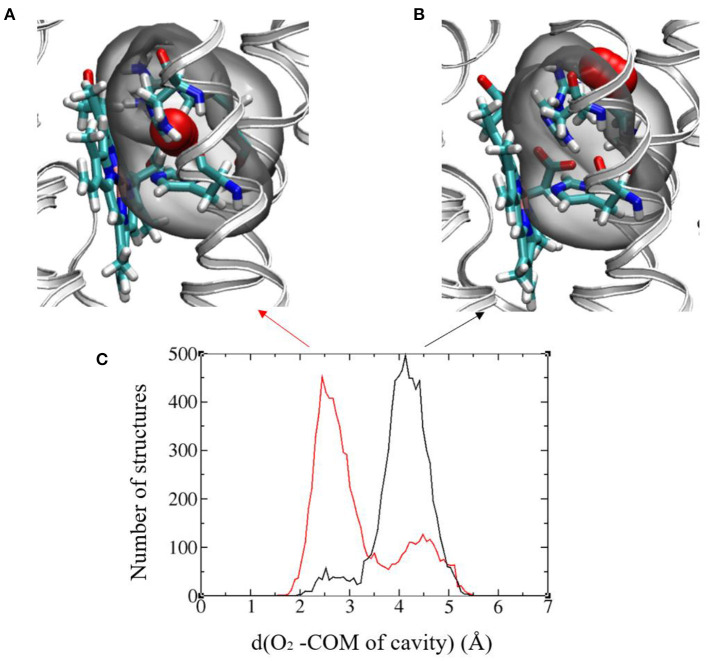
Figure 7.
(A) and (B) Images showing the two favored O2 positions with respect to the binding cavity. The protein backbone is represented in gray ribbon and the cavity is highlighted in all-atom representation: Arg256, His313, and His317 and Heme2, O2 (in red). The cavity in gray bubble. (C) Histograms of the distance between O2 and the center of mass (COM) of the cavity in the initial (black) and final (red) redox states. Results from the 300ns-long MD runs.

