
Figure 8.
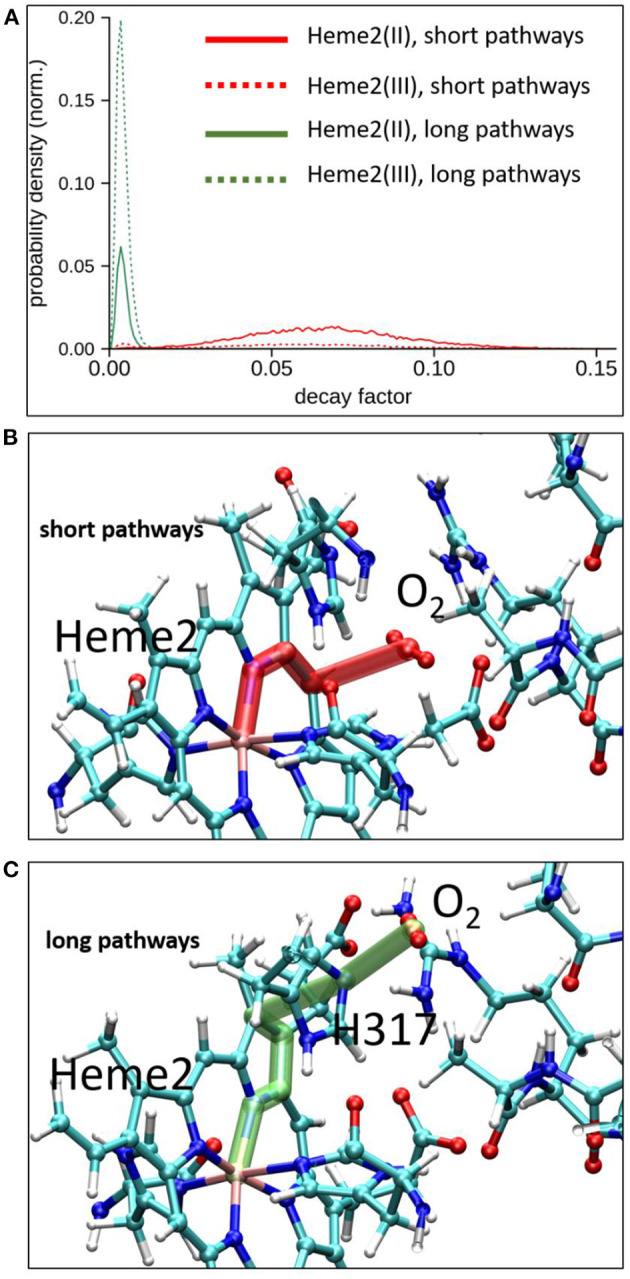
Electron tunneling pathway analysis between Heme2 and the dioxygen molecule. Top, normalized distributions of decay factors collected along the MD simulations in initial and final redox states of the inter-heme ET [(Heme2(III)) and Heme2(II) respectively]. Middle and bottom, representative snapshots of the two dominant pathways encountered during MD simulations.