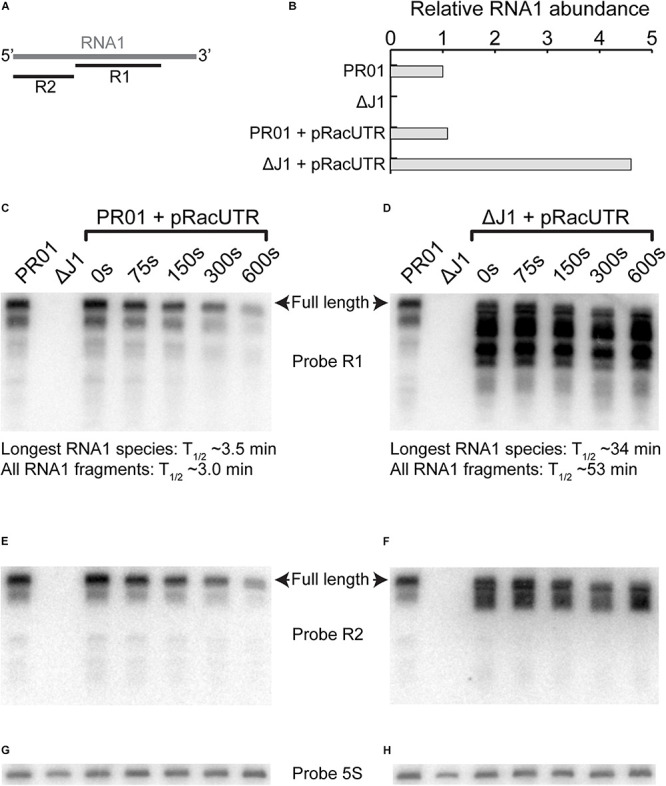
FIGURE 9.

RNA1 degradation and abundance. (A) Overview of where probe R1 and R2 hybridizes on RNA1. (B) Level of RNA1 is similar for pSA564 and pRacUTR in PR01, but the overall intensity of the combined RNA1 bands are much higher in ΔrnjA. (C,D) Rifampicin was used to block transcription and RNA was extracted at different time points to follow the rate of degradation by Northern blotting. The intensity of longest RNA1 species detected for each time-point was used to calculate the RNA1 half-life. However, RNA1 fragments accumulate in the ΔrnjA mutant, and these shorter RNA1 fragments cannot be readily quantified individually, so we here present the half-life of the combined signal of the R1 probe (i.e., all bands pooled). (E,F) A second probe (R2) against RNA1, this time targeting the 5′-end was used to re-probe the same membrane as in (C,D), respectively. (G) Probe against 5S rRNA to normalize the membrane shown in (C,E). (H) Probe against 5S rRNA to normalize the membrane shown in (D,F).
