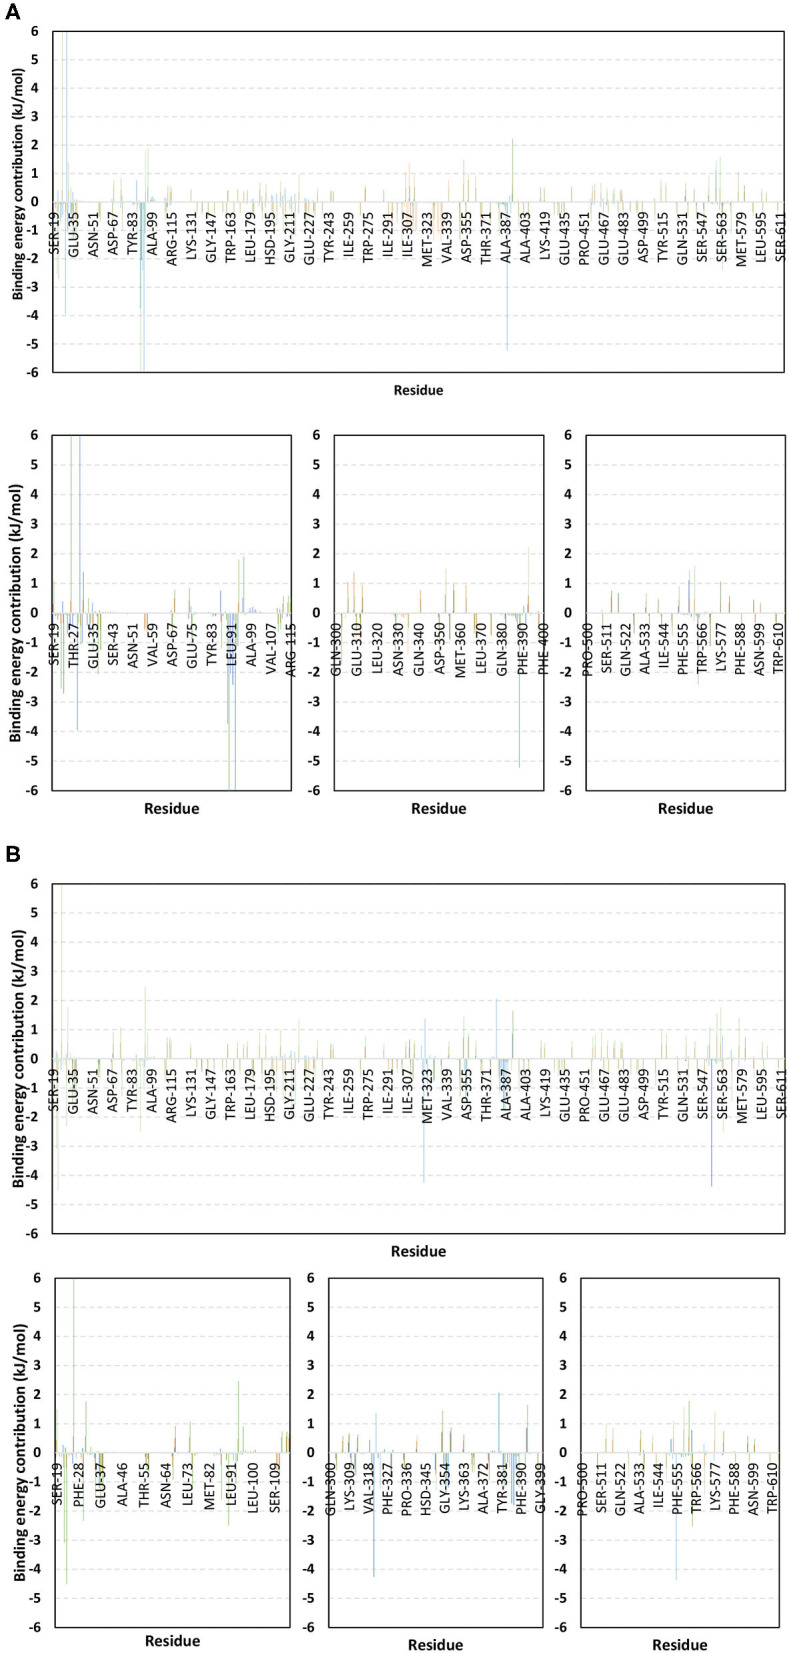
Figure 10.

Binding-free energy/residue decomposition illustrating the protein residue contribution at alacepril-hACE2 protein complex ΔGbinding calculation. The residue-wise energy contributions across (A) 30–70 ns and (B) 80–100 ns MD simulation timeframes were represented in blue, brown, and green colored bars for alacepril, lisinopril, and NAG, respectively. Lower panels are expanded versions of three designated residue regions (19–115, 300–400, and 500–614) of the upper panels.
