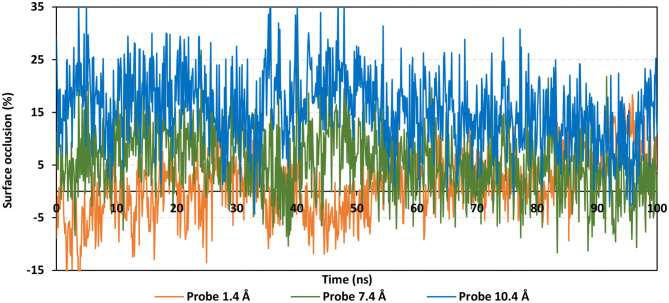
Figure 8.
Extent of hACE2 binding site coverage via SASA analysis along with the time evolution 100 ns all-atom MD simulation. Surface occlusion is defined as the surface percentage being covered via NAG being calculated relying on the SASA differences for the binding site surface in the presence and absence of NAG glycans. Three different probe sizes (1.4, 7.2, and 10 Å) were utilized for calculating the SASA values. Data are represented as % surface occlusion vs. the MD simulation time in nanoseconds.

