FIGURE 5.

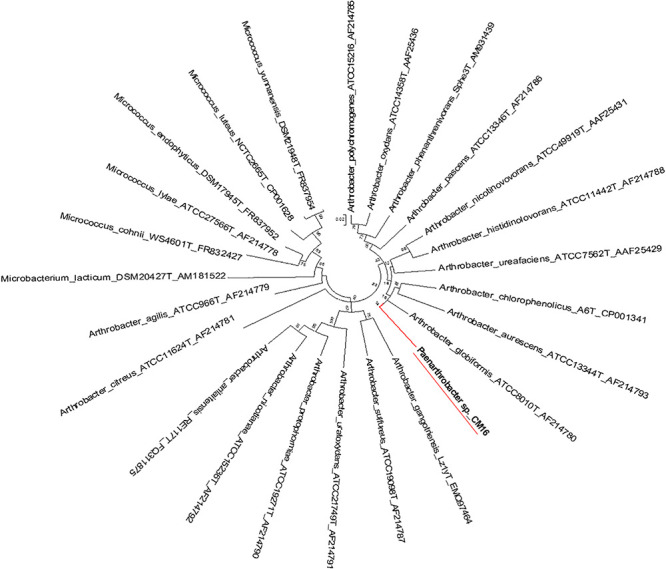
Molecular phylogenetic analysis of Arthrobacter recA-gyrB genes by Maximum Likelihood method. Phylogenetic tree is drawn to scale, with branch lengths measured in the number of substitutions per site.

Molecular phylogenetic analysis of Arthrobacter recA-gyrB genes by Maximum Likelihood method. Phylogenetic tree is drawn to scale, with branch lengths measured in the number of substitutions per site.