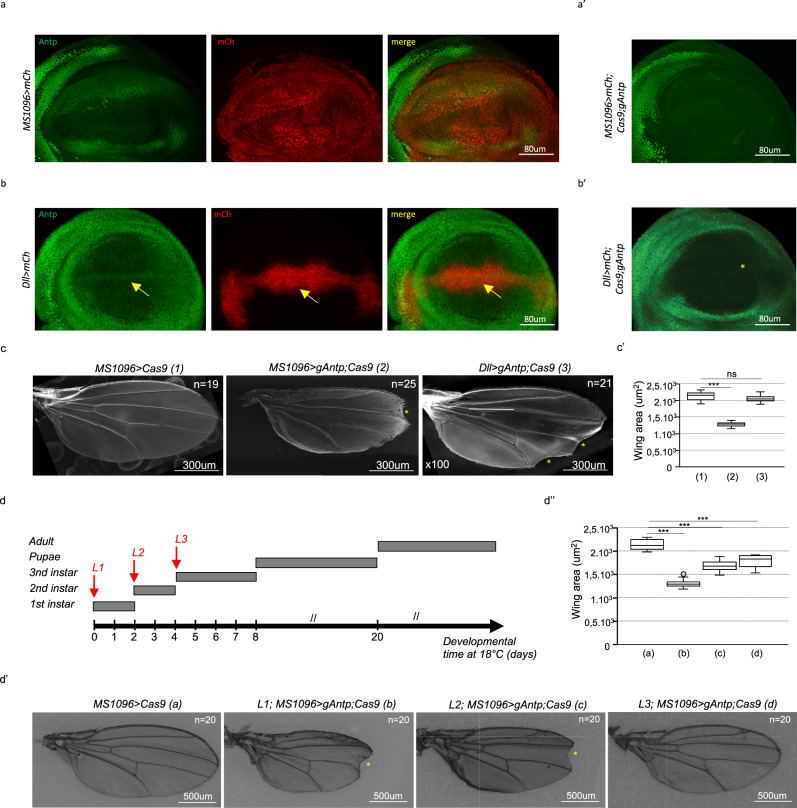
Fig. 2. Antennapedia (Antp) is required for correct distal wing formation in Drosophila.
a, b Expression of the red fluorescent reporter mCherry (mCh, red) with the MS1096-Gal4 (a) or Distalless(Dll)-Gal4 (b) driver does not affect the expression of Antp (green) in the wing pouch (n = 5 from one experiment). Yellow arrow highlights Dll-Gal4 and Antp co-expressing cells along the dorsal–ventral boundary of the early L3 wing disc pouch. a′, b′ Expression of gRNAs and Crispr/Cas9 against Antp with MS1096 (a′) or Dll-Gal4 (b′) abolished the expression of Antp (green; n = 10 from two independent experiments). Note that MS1096 starts at the L1 stage and its expression profile is not restricted to the pouch. c Illustrative SEM pictures of adult wings from control (MS1096-Gal4 driver with UAS-Cas9, n = 18) and Antp-mutant (MS1096-Gal4 or Dll-Gal4 driver with UAS-Cas9 and UAS-gRNAs against Antp, n = 25 or 19, respectively) males, as indicated. The yellow star indicates wing margin defect (observed in 61 and 90% of MS1096-Gal4 and Dll-Gal4 dissected wings, respectively). c′ Boxplot representation of wing area quantification in the control (1) and MS1096-Gal4 (2) or Dll-Gal4 (3) induced Antp-mutant flies. Boxplots indicate 25th and 75th percentiles, whiskers show ±1.5 × IQR and center line depicts median of three biological replicates (unpaired two-tailed t test with Welch’s correction ***p = 1.66e−20 with MS1096 and nonsignificant (ns) with Dll-Gal4. d Developmental time course of Drosophila larval stages at 18 °C. Shifts at 29 °C to abolish the activity of Gal80 and induce the expression of Antp gRNAs were performed at early L1, L2, and L3 stages, as indicated. d′ Illustrative pictures of adult wings in the control experiment (a) or upon the expression of Antp gRNAs with the MS1096-Gal4 driver at the L1 (b), L2 (c), and L3 (d) stages. Margin defects (yellow stars) were observed when Antp expression was affected at the L1 (58%) and L2 (43%) but not L3 stage. d″ Quantification of wing size defects in the different conditions. Boxplots indicate 25th and 75th percentiles, whiskers show ±1.5 × IQR and center line depicts median of three biological replicates (unpaired two-tailed t test with Welch’s correction ***p = 1.8e−24 at L1, ***p = 6.5e−15 at L2, ***p = 1.2e−10 at L3).

