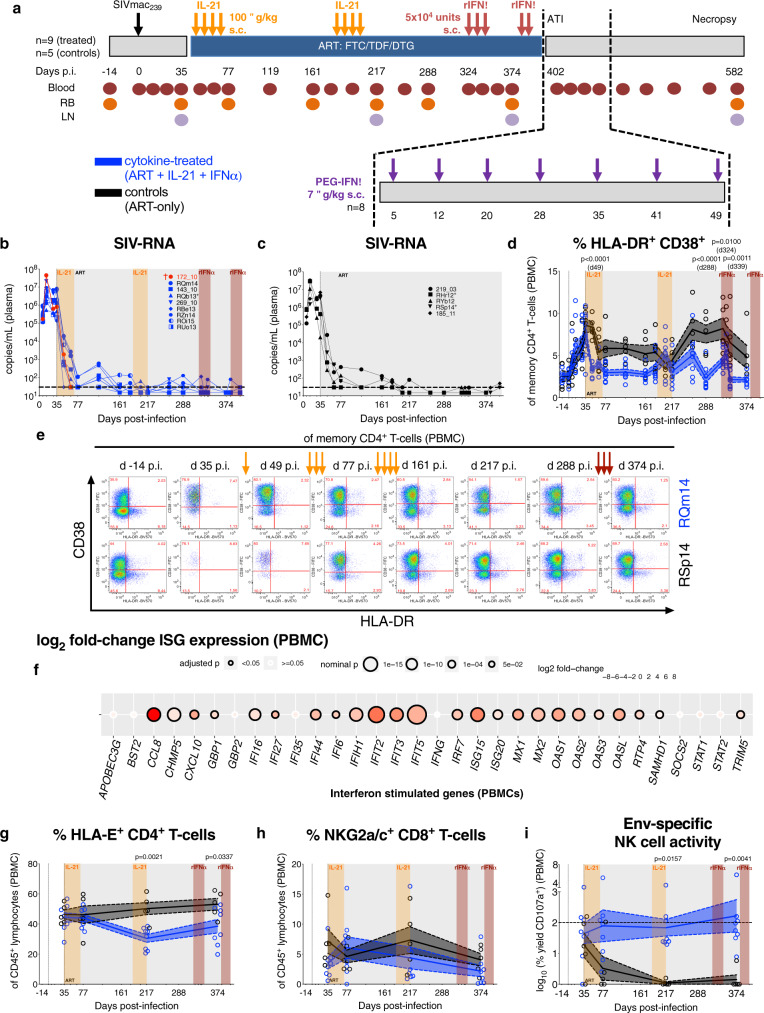
Fig. 1. IL-21 and rIFNα immunotherapies are biologically active in SIV-infected, ART-treated RMs.
a Cartoon schematic of study design as detailed in the Results and Methods. Plasma viral loads (SIV-RNA copies/mL) were longitudinally measured by qRT-PCR with individual b cytokine-treated (ART + IL-21 + IFNα; blue; n = 9 RMs) and c control (ART-only; black; n = 5 RMs) RMs represented by distinct shapes. The dashed horizontal line represents the assay’s limit of detection (30 copies/mL) with undetectable events plotted as 15 copies/mL. d The frequency of immune activation (HLA-DR+CD38+) was quantified in memory (CD95+) CD4+ T-cells in PBMCs and e representative flow cytometry plots are given at critical time points (as indicated above) for a cytokine-treated (RQm14) and control RMs (RSp14; 16 of 260 single-replicate stains). f The expression of IFN-stimulated genes (ISGs) was measured by RNA-seq in PBMCs at 2 h post-rIFNα and was calculated as a log2 fold-change between rIFNα-treated (n = 6) and control RMs (n = 5), which is represented as a double-gradient heatmap. The size of each data point corresponds inversely to the log10-transformed nominal p value with significant (p < 0.05) adjusted p values indicated by a black border. Using DESeq2, data were analyzed with a two-sided (95% CI) Wald test using the Benjamini–Hochberg method for multiple comparisons. By flow cytometry, the frequency of g HLA-E+ CD4+ T-cells and h NKG2a/c+ CD8+ T-cells was quantified of CD45+ lymphocytes in PBMCs. i NK cells isolated from PBMCs were cultured alone or the presence of K562-HLA-E*0101 cells either unloaded or loaded with SIVmac239/251 Env peptides. The SIV-Env-specific, HLA-E-restricted activity was calculated as the log10-transformed percent yield of CD107a surface expression on NK cells by flow cytometry and the horizontal dashed line represents 100% activity. b–d, g–i Treatment phases are indicated with the following background shading: IL-21 (orange), rIFNα (red), and ART (gray). d, g–i Data from individual RMs (staggered open circles) are overlaid against the mean (solid line) ± SEM (shaded region within the dashed lines): control (black; n = 5) and cytokine-treated (blue; n = 8). Data were analyzed with a d, g–i two-sided (95% CI), two-way ANOVA with Bonferroni’s correction for multiple comparisons with cross-sectional comparisons relative to controls.

