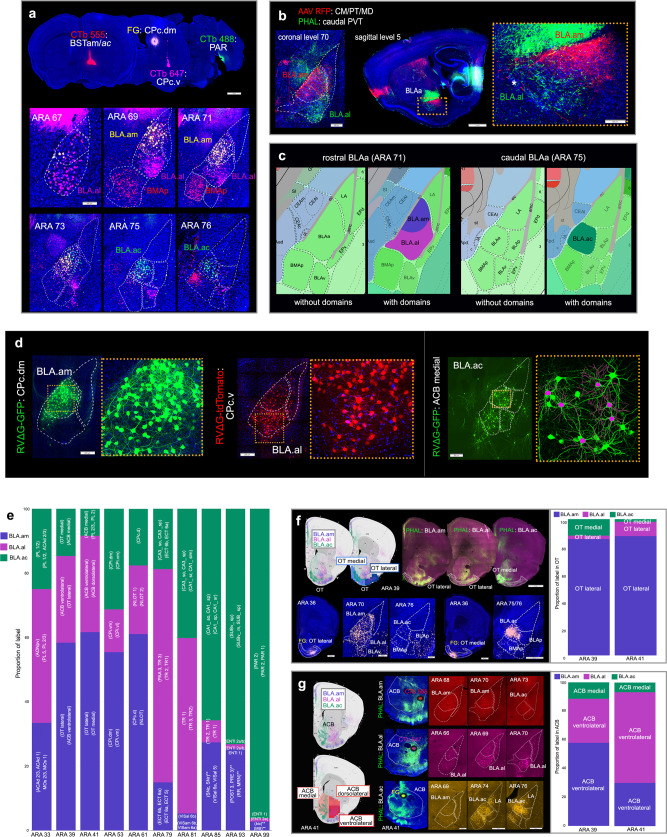
Fig. 1. Uniquely connected BLAa neurons.
a Four retrograde tracer injections in BSTam (CTb 555: red), CPc.dm (FG: yellow), CPc.v (CTb 647: pink), and in PAR (CTb 488: green) reveal uniquely connected projection neurons in BLAa. Note segregation of FG (yellow) and CTb 647 (pink) labeled cells in BLA.am and BLA.al, respectively at ARA levels 69 and 71. Also note absence of PAR projecting CTb 488 (green) labeled cells in at ARA levels 67–71. b Anterograde tracers AAV-RFP and PHAL injected in different thalamic nuclei distinctly label BLA.am and BLA.al, which is evident in coronal (left) and sagittal (right) planes. Inset shows magnified version of boxed BLAa region. An asterisk denotes outer boundary of BLAa. c. Atlas representations of rostral (ARA 71) and caudal (ARA 75) regions of BLAa with and without domains. d Left: RVΔG injected in CPc.dm (green) and CPc.v (red) distinctly label BLA.am and BLA.al projection neurons, respectively. Insets show magnified version of boxed regions. Right: RVΔG injected in ACB medial labels BLA.ac neurons. Soma and dendrites of neurons selected for reconstruction are shown in pink. e Bar chart describes proportion of label per ARA section from representative anterograde tracer injections in BLA.am, BLA.al, and BLA.ac (n = 1 each) to show their discrete brain-wide connectional patterns. The ROIs for grids with strongest projections from each injection are displayed in parentheses (e.g., strongest projections from BLA.am neurons at ARA 39 are to OT lateral and ACB ventrolateral). Overall, BLA.am has stronger projections at rostral levels compared to BLA.al and BLA.ac. Caudal levels (ARA 85–99) receive more projections from BLA.ac than from BLA.am or BLA.al, primarily targeted to hippocampal structures CA1, SUB, and PAR. Each grid can include more than one ROI [e.g., (PL2, PL1)]. ** denotes anterograde projections that were not validated with retrograde tracers. f BLA.am, BLA.al, and BLA.ac projections to OT at ARA 39, which was split into medial (light blue) and lateral (dark blue) regions. BLA.am and BLA.al neurons target OT lateral, while those in BLA.ac target OT medial. Bottom panels show validation of these projections via retrograde FG injections. An OT lateral FG injection strongly labels BLA.am and BLA.al cells, but also BLAv cells, while an OT medial FG injection labels BLA.ac neurons and BLAp and BMAp neurons. The bar chart quantifies and visualizes the density of BLAa→OT connections at ARA levels 39 and 41 (n = 1 each). g BLA.am, BLA.al, and BLA.ac projections to ACB at ARA 41, which was split into medial (light orange), dorsolateral (orange), and ventrolateral (dark orange) regions. BLA.am and BLA.al neurons target mostly ACB ventrolateral, while those in BLA.ac innervate ACB medial. BLAa→ACB projections are shown with PHAL (green) injections made into BLA.am, BLA.al, and BLA.ac. Ellipses denote locations of retrograde tracer injections used to validate BLAa→ACB connections. CTb 555 injected into ACB ventrolateral regions labels BLA.am neurons (BLA.am→ACB ventrolateral), CTb 647 into ACB ventrolateral regions labels BLA.al neurons (BLA.al→ACB ventrolateral), and FG injected into ACB medial labels BLA.ac neurons (BLA.ac→ACB medial). Bar charts show quantified and visualized density of BLAa→ACB connections at ARA levels 39 and 41 (n = 1 each). Abbreviations: ac anterior commissure, ACAd dorsal anterior cingulate area, ACB nucleus accumbens, AONpv anterior olfactory nucleus posteroventral part, bic brachium of the inferior colliculus, BSTam anteromedial bed nucleus of stria terminalis, CA1_so CA1 stratum oriens, CA1_sp CA1 pyramidal layer, CA1_sr CA1 stratum radiatum, CA3_so CA3 stratum oriens, CA3_sp CA3 pyramidal layer, ccg genu of the corpus callosum, CM central medial thalamic nucleus, CPc caudal caudoputamen, CPc.dm caudal caudoputamen, dorsomedial part, CPc.v caudal caudoputamen, ventral part, CPi.dm intermediate caudoputamen, dorsomedial part, CPi.vl intermediate caudoputamen, ventrolateral part, CPi.vm intermediate caudoputamen, ventromedial part, CPc.d caudal caudoputamen, dorsal part, ECT ectorhinal cortical area, ENTl entorhinal cortex, lateral part, MB midbrain, MD mediodorsal thalamic nucleus, MOs secondary motor area, MRN midbrain reticular nucleus, NLOT nucleus of the lateral olfactory tract, OT olfactory tubercle, PAR parasubiculum, PL prelimbic cortical area, POST postsubiculum, PRE presubiculum, PT parataenial thalamic nucleus, PVT paraventricular thalamic nucleus, RR retrorubral area, SNc substantia nigra, compact part, SNr substantia nigra reticular part, SUBv_m ventral subiculum molecular layer, SUBv_sp ventral subiculum pyramidal layer, TR postpiriform transition area, VISal anterolateral visual area, VISam anteromedial visual area. See Table 1 for full list of abbreviations.

