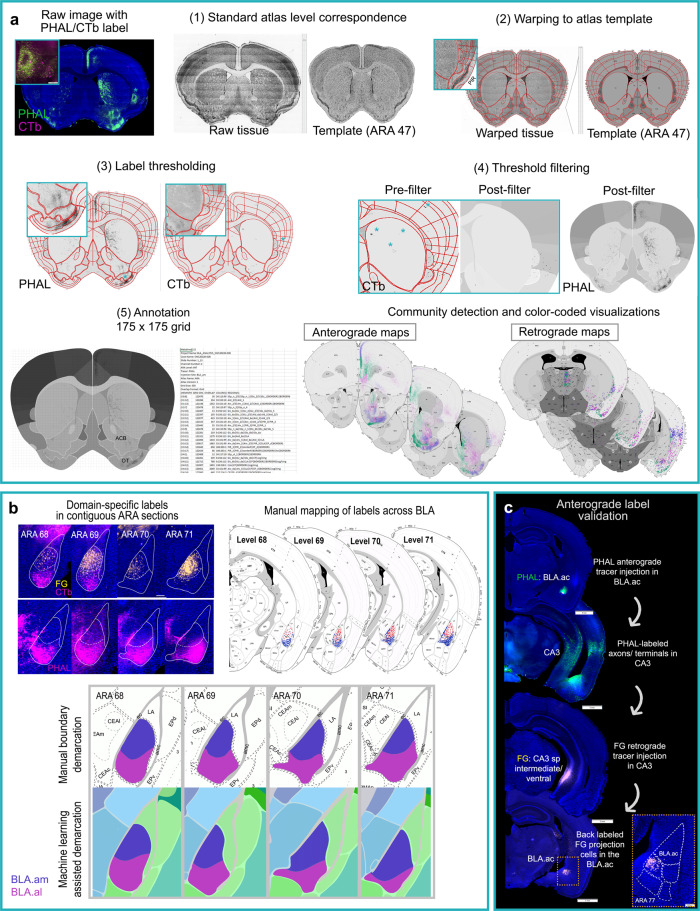
Fig. 2. Data processing and analysis workflows.
a Summary of our 2D post-image processing pipeline. Images with fluorescent tracers (e.g., green PHAL fibers and pink CTb cells) are acquired under 10x magnification. Images are then imported into an in house software Connection Lens for (1) atlas correspondence to match each section to its corresponding ARA atlas template, (2) to warp data sections to atlas templates, (3) to threshold labeling, (4) filter artifacts, and (5) annotate the labels. Boxed region in (2) shows magnification of piriform cortex (PIR) to illustrate accuracy of registration details. Insets in (3) display magnified regions demonstrating accuracy of segmented PHAL fibers and CTb cells. In (4) asterisks highlight filtered artifacts to reduce false positive signals. Annotation was performed at the grid level (175 × 175 pixels) to capture topographic labels within ROIs that otherwise would go undetected [e.g., olfactory tubercle (OT), nucleus accumbens (ACB)]. Overlap processing (5) results in an file with annotated values: pixel density for anterograde tracers and cell counts for retrograde tracers. A modularity maximization algorithm is applied to the annotated data to assign labels to an injection site based on label density. Community assignments are color-coded by injection site and visualized for 32 ARA sections for anterograde and retrograde maps (available at https://mouseconnectomeproject.github.io/amygdalar/). b Workflow for delineating BLAa domain boundaries (also Supplementary Fig. 2). First, cases with domain-distinct labels were selected (n = 7) and contiguous sections through the BLAa were collected, imaged, and registered. Labels for each case were manually mapped onto a standard atlas in individual layers. Borders were manually drawn guided by mapped labels, but also by Nissl cytoarchitecture (Supplementary Fig. 3b). The same data was used to train a machine learning algorithm, which produced similar automated delineations of BLAa domains (Supplementary Fig. 3a). c Validation of anterograde labeling with retrograde tracers. PHAL injected in BLA.ac labels CA3. A FG injection in CA3_sp pyramidal layer back-labels BLA.ac projection cells confirming the BLA.ac→CA3 connection. Inset is magnification of boxed region showing selective and confined CA3 projecting FG-labeled cells in BLA.ac.

