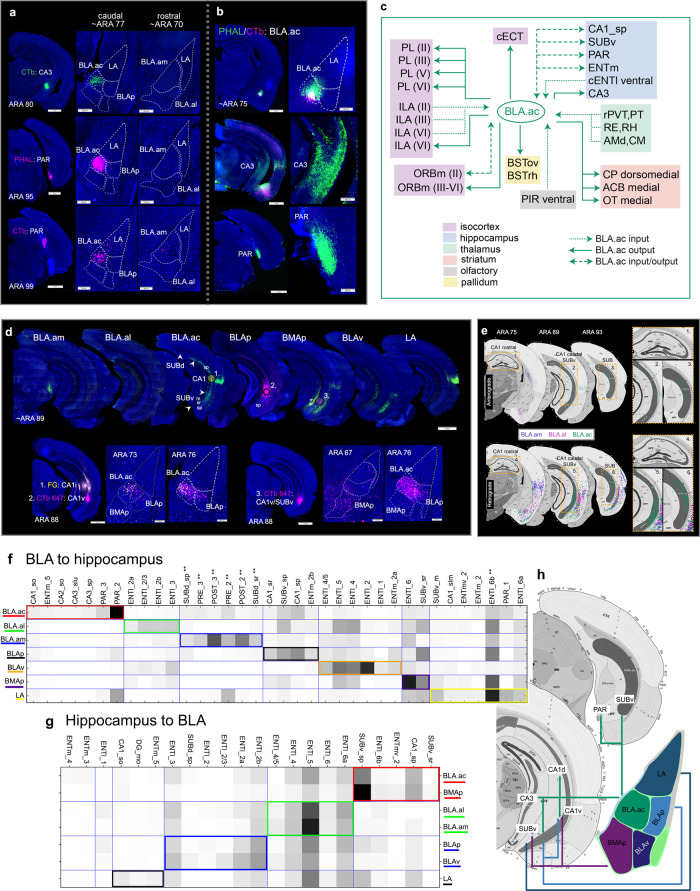
Fig. 4. BLA.ac connections with hippocampus.
a BLA.ac connections with hippocampal regions. A CTb (green) CA3 tracer injection selectively labels BLA.ac projection neurons (BLA.ac→CA3). Note the absence of labeled cells in BLA.am. A PHAL (pink) and CTb (pink) injection in PAR show the BLA.ac→PAR and PAR→BLA.ac connections. b These connections were validated with a PHAL/CTb BLA.ac injection that shows strong PHAL fiber labels in CA3 and PAR. c Summarized brain-wide connections of BLA.ac projection neurons. For full abbreviation list see Table 1. d Top panels show projections from BLA.am, BLA.al, BLA.ac, BLAp, BMAp, BLAv, and LA neurons to hippocampal regions. The BLA.ac, BLAp, and BMAp show strongest projections, with BLA.ac projecting to sp layers of CA1 and SUBv (BLA.ac→CA1_sp/SUBv), BLAp to CA1v and SUBv (BLAp→CA1v_sp/SUBv), and BMAp to sr and m layers of CA1v and SUBv (BMAp→CA1v_sr/SUBv_m/sr). Bottom panels show validation of these connections with FG and CTb injections marked 1–3 on top panels. Injections 1 and 2 show FG and CTb injections in intermediate (CA1i) and ventral (CA1v) CA1, respectively. Both injections back-label projection neurons in BLA.ac, while only the injection in CA1v labels BLAp neurons. Injection 3 is a CTb injection in SUBv, which labels BLA.ac, BLAp, and BMAp neurons. e Top panels show BLAa projections to rostral CA1 and more caudal CA1 and SUB. Boxed regions are numbered and magnified to the right. Bottom panels show projections from CA1 and SUB back to BLAa. Note exclusive BLA.ac connections with the hippocampus, particularly its caudal regions (Fig. 7n shows PHAL validation of these connections). f Community detection confined to BLA projections to hippocampal areas was run and visualized in a matrix. The matrix was reordered such that grouped injection sites and their strongest projections are arranged along the diagonal and boxed in different colors. The weighting of each connection is indicated by a color gradient from black (very strong) to white (very weak). Note (1) projections from BLA.ac to PAR and CA3, (2) from BLAp to CA1_sp and SUBv_sp, (3) from BLAv to ENTl (layers II and V), and (4) from BMAp to SUBv_sr. ** indicates strong connections that were not validated. g Community detection confined to hippocampal inputs to BLA was run and visualized in a matrix. Note (1) BLA.ac and BMAp are grouped with strong inputs from CA1 and SUBv and (2) BLA.am and BLA.al grouped with strong input from ENTl. Matrix analysis was ROI based, not grid based. h Schematic summarizing connections of all BLA nuclei with hippocampal areas. See Table 1 for full list of abbreviations.

