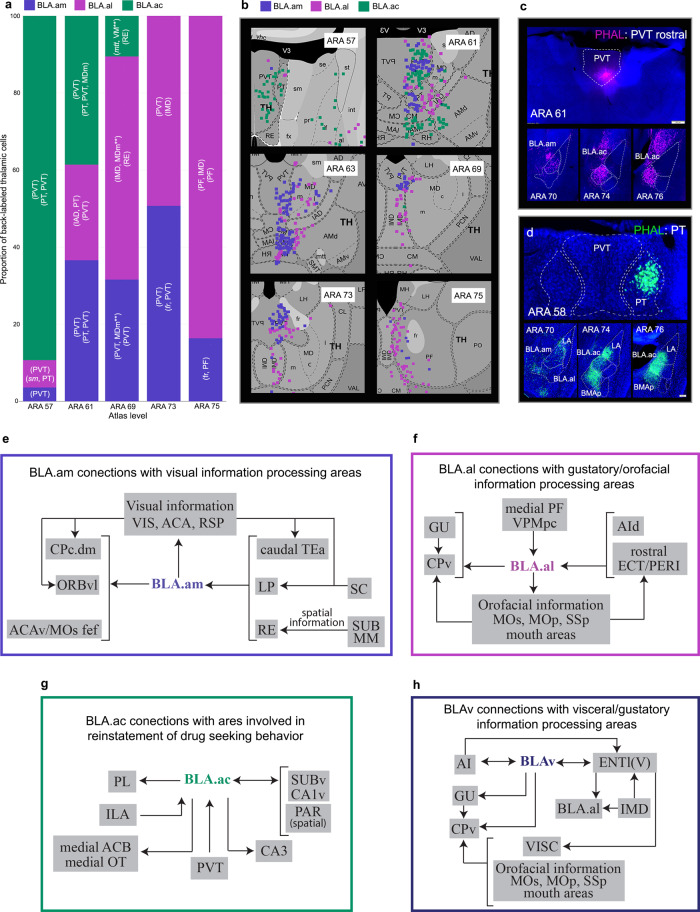
Fig. 6. BLAa-thalamic connections and BLAa functional diagrams.
a Bar chart showing proportion of back-labeled thalamic neurons from representative retrograde tracer injections in BLA.am, BLA.al, and BLA.ac (n = 1 each). ROIs for grids with strongest labels from each injection is included. A grid can include multiple ROIs [e.g., (PT, PVT)]. Note the greater proportion of thalamic PVT labeling from BLA.ac injection at rostral levels (ARA 57, 61) versus the larger proportion of thalamic PVT label from BLA.am and BLA.al injections in caudal levels (ARA 73), which substantiates the rostral and caudal PVT distinction. Also, greatest thalamic input to BLA.am is from caudal PVT (caudal PVT→BLA.am), greatest input to BLA.al is from caudal PVT, PF, and IMD (caudal PVT/PF/IMD→BLA.al), and greatest input to BLA.ac is from PT and rostral PVT (PT/rostral PVT→BLA.ac). ** denotes connections that were not validated with anterograde tracing. b Retrograde maps from ARA 57–75 showing back-labeled thalamic nuclei from injections in BLA.am, BLA.al, and BLA.ac that corroborate the bar chart in (a). c PHAL injection in rostral PVT validates the rostral PVT→BLA.ac connection. d PHAL injection in PT validates the PT→BLA.ac connection, but also shows strong PT projections to LA and BMAp (PT→BMAp/LA). e. BLA.am connections with areas associated with visual processing. f BLA.al connections with areas associated with gustatory and orofacial information processing. g BLA.ac connections with areas involved in reinstatement of drug seeking behavior. h BLAv connections with visceral/gustatory information processing areas. See Table 1 for full list of abbreviations.

