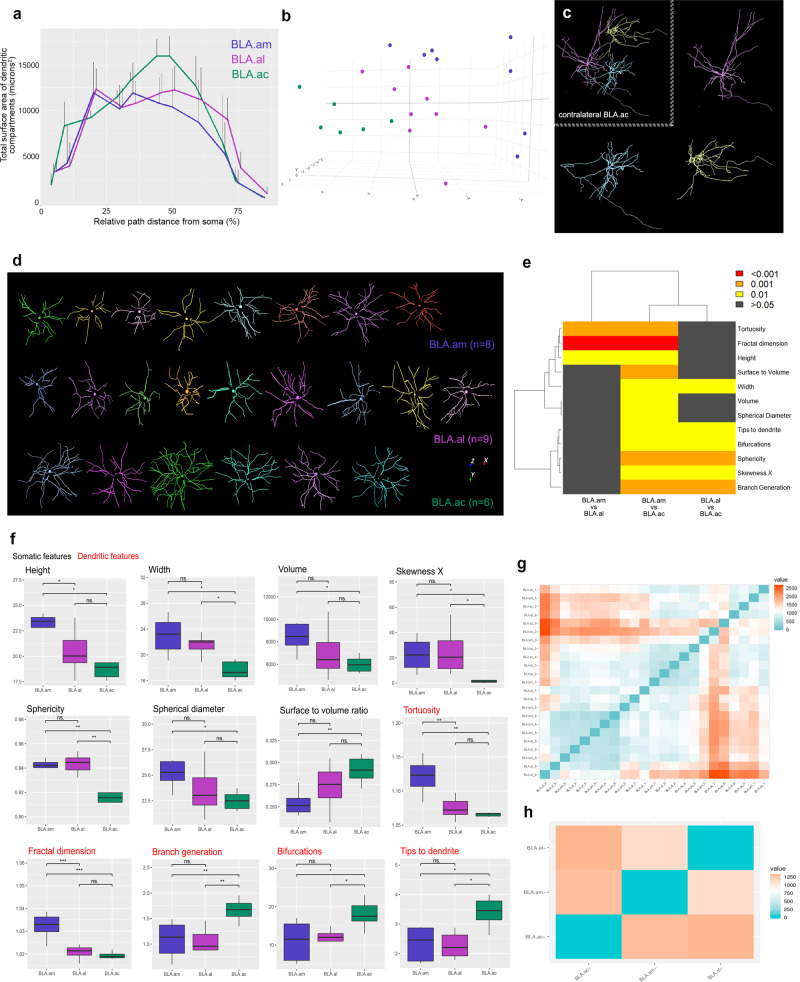
Fig. 9. BLAa neuron morphology.
a Result of Sholl-like analysis to show overall view of BLAa projection neuron dendritic morphology. Graph shows that dendrites of neurons within the BLA.ac have a larger surface area of dendritic compartments at ~45% distance from the cell body compared to dendritic compartments of BLA.am and BLA.al neurons. This larger dendritic surface area suggests the potential for a greater number of synaptic contacts for BLA.ac neurons. b 3D scatterplot of principal component analysis (PCA) shows segregation of BLAa domain-specific neurons based on measured morphological features. c Contralateral medial accumbens (ACB) projecting BLA.ac neurons. Neurons were labeled via a rabies virus injection in the ACB medial and neurons in contralateral BLA.ac were manually reconstructed. d All reconstructed dorsal striatum projecting BLA.am (n = 8) and BLA.al (n = 9) neurons and ventral striatum projecting BLA.ac neurons (n = 6). Reconstructions were used to assess differences in morphological features across the domain-specific projection neurons. e–f Two-sided pairwise Wilcoxon rank sum tests were run on morphometric data and the parameters that survived the false discovery rate (FDR) correction for multiple testing are reported. Significant group differences are presented with whisker plots in panel (f) and the degree of their significance is visualized in a matrix in (e). Somatic features are presented in black font and dendritic features are in red. The center line represents the median, the box limits the upper and lower quartiles, and the whiskers the 1.5x interquartile range. * denotes p < 0.05, ** p < 0.005, *** p < 0.0005, and ns = not significant. See Statistical analysis of morphometrics in “Methods” for full statistical reporting. Source data are provided as a Source Data file. The dendrogram on top of the matrix shows the hierarchical clustering of groups based on feature similarity. It suggests that BLA.am and BLA.al neurons differ more from those in BLA.ac than they do from each other. g Persistence-based neuronal feature vectorization framework was also applied to summarize pairwise differences between BLA.am, BLA.al, and BLA.ac projection neurons. The strength of the differences is presented as a gradient with blue showing no difference and orange the greatest differences. The individual neuron differences are aggregated in (h), which shows once again that neurons within BLA.am, BLA.al, and BLA.ac all differ from one another, but that the greatest difference lies between BLA.am/BLA.al neurons versus BLA.ac neurons.

