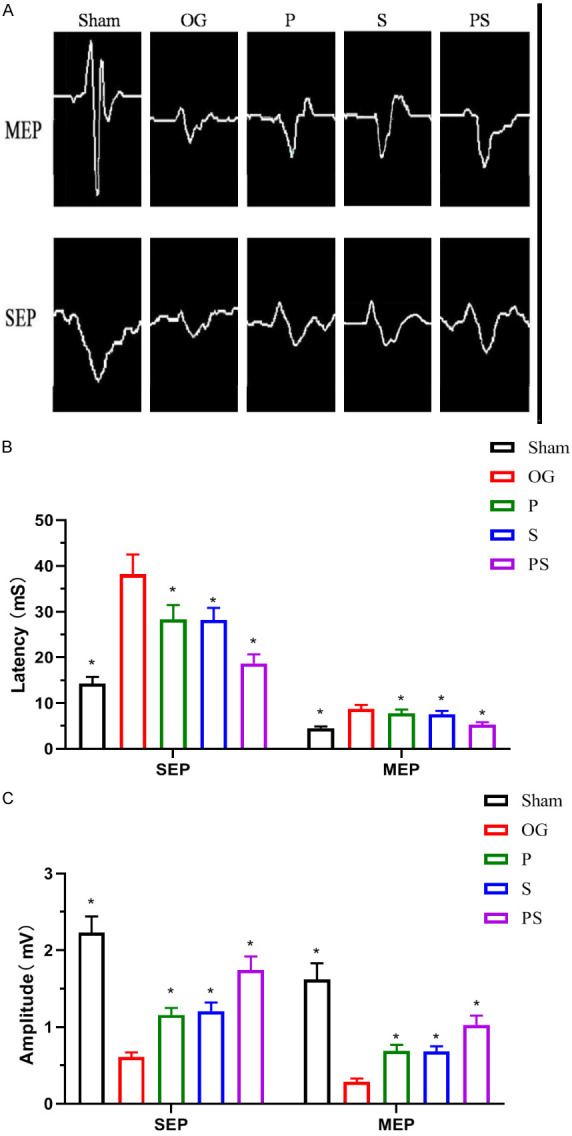
Figure 4.

Neuroelectrophysiological detection after spinal cord injury in each group. (A) shows the electrophysiological results of rats in each group recorded at the 8th week after surgery. (B and C) shows that the amplitude of SEP and MEP in group PS was significantly higher than that in group P and S, and the latency was significantly shorter than that in these two groups. There was no significant difference in SEP and MEP between group P and S.
