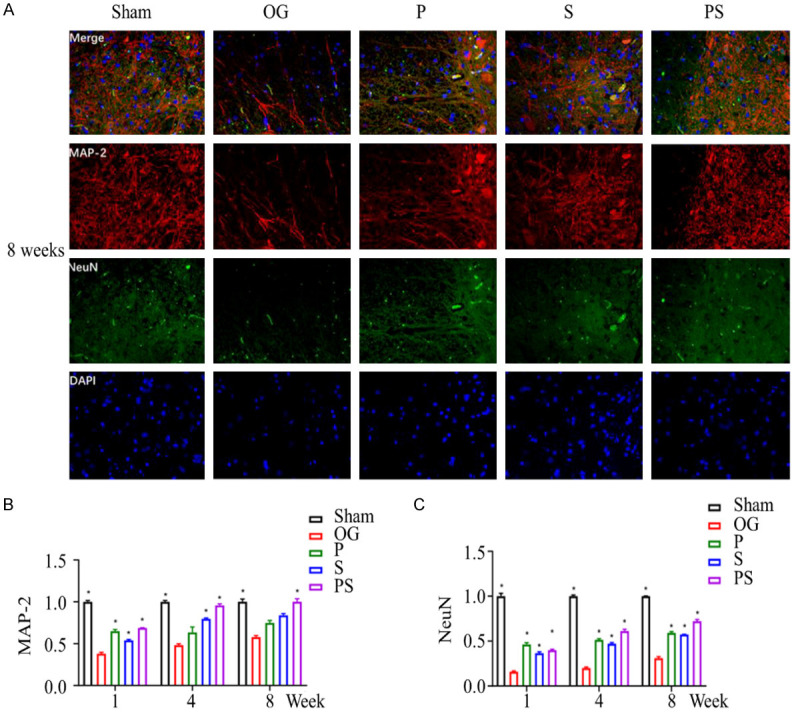
Figure 6.

The neuronal survival after spinal cord injury in each group was detected by immunofluorescence staining. (A) shows the positive cells of MAP2 and NeuN in SCI site cells at the 8th week. (B and C) show the highest expression levels in group PS, which was significantly higher than that in groups P and S.
