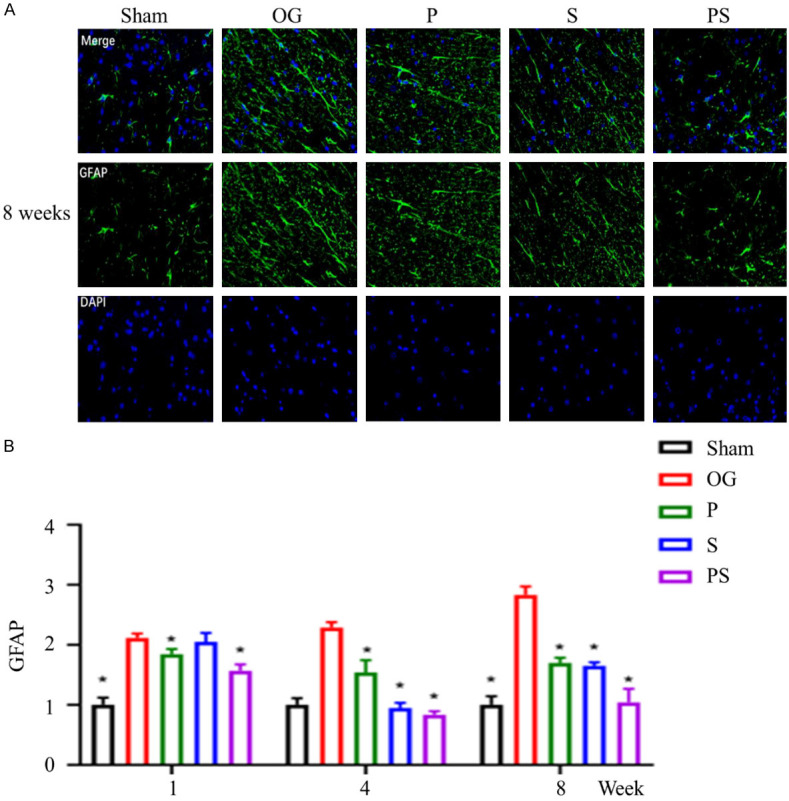
Figure 7.

The formation of glial scar after spinal cord injury in each group. (A) shows the number of GFAP positive cells in each group at week 8. (B) shows the number of GFAP positive cells in each group at week 1, 4, and 8, from which it could be seen that the positive rate of GFAP in the spinal cord of group PS is significantly lower than that of the other groups. By week 8, the number of GFAP positive cells had decreased to a level close to that of the control group.
