
Figure 3.
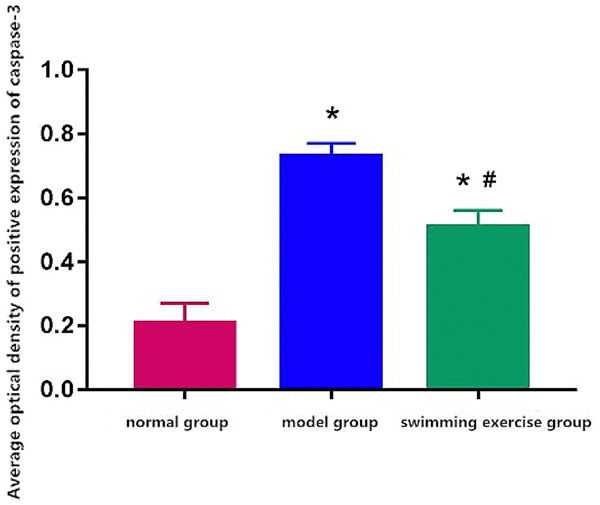
Average optical density of positive expression of caspase-3. Note: *P < 0.05 vs. normal group, #P < 0.05 vs. model group.
Official websites use .gov
A
.gov website belongs to an official
government organization in the United States.
Secure .gov websites use HTTPS
A lock (
) or https:// means you've safely
connected to the .gov website. Share sensitive
information only on official, secure websites.
Average optical density of positive expression of caspase-3. Note: *P < 0.05 vs. normal group, #P < 0.05 vs. model group.