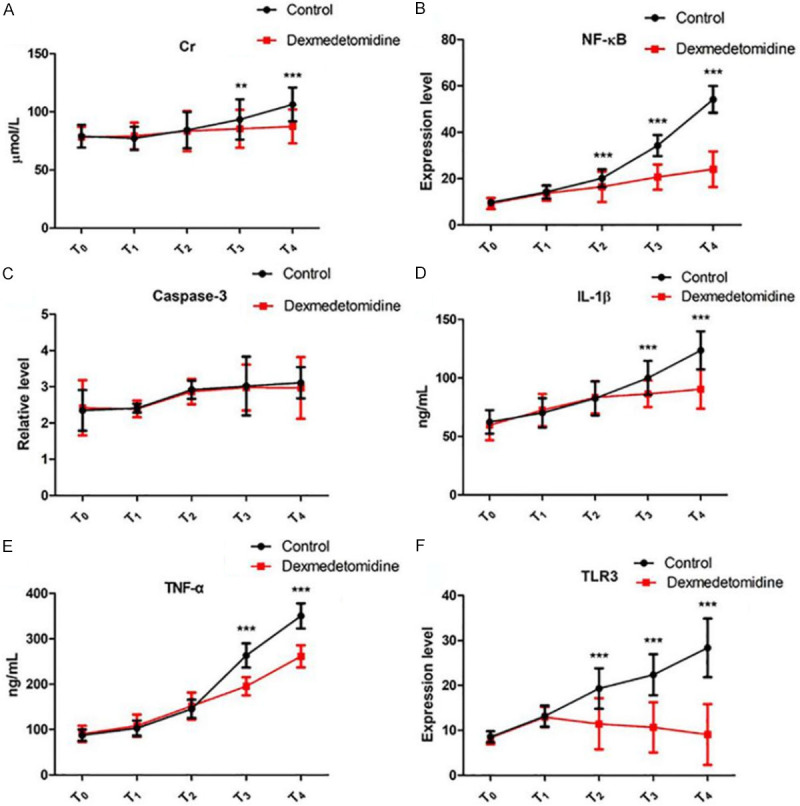
Figure 4.

Expression levels of sCr, NF-κB, Caspase-3, IL-1β, TNF-α, and TLR3. A: sCr levels at different time points in the two groups; B: NF-κB levels at different time points in the two groups; C: Caspase-3 levels at different time points in the two groups; D: IL-1β levels at different time points in the two groups; E: TNF-α levels at different time points in the two groups; F: TLR3 levels at different time points in the two groups. Compared with the control group, **P<0.01; compared with the control group, ***P<0.001. T0: before operation; T1: 30 min after anesthesia induction; T2: 24 h after operation; T3: 48 h after operation; T4: 72 h after operation; sCr: serum creatinine; IL: interleukin; TLR: toll-like receptor; TNF: tumor necrosis factor; NF-κB: nuclear factor kappa-B.
