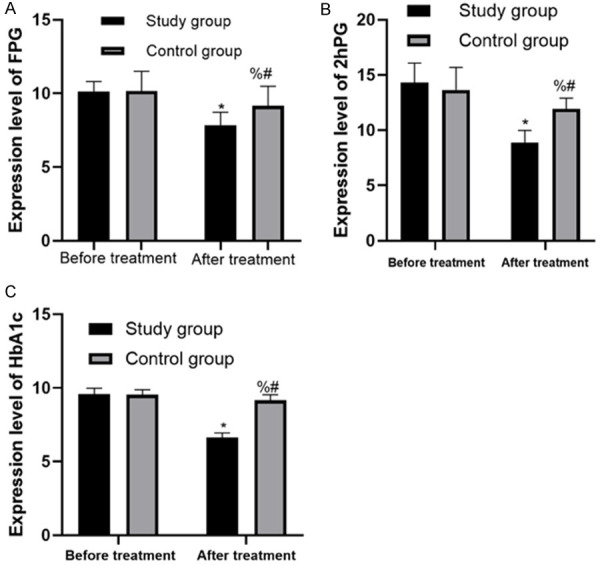
Figure 1.

Changes of diabetes control indexes before and after treatment in the two groups. A. Changes of FPG in the two groups before and after treatment; B. Changes of 2hPG in the two groups before and after treatment; C. Changes of HbA1c in the two groups before and after treatment. * represents the comparison with the SG before treatment, P < 0.05; % represents the comparison with the SG after treatment, P < 0.05; # represents the comparison with the CG before treatment, P < 0.05.
