
Figure 1.
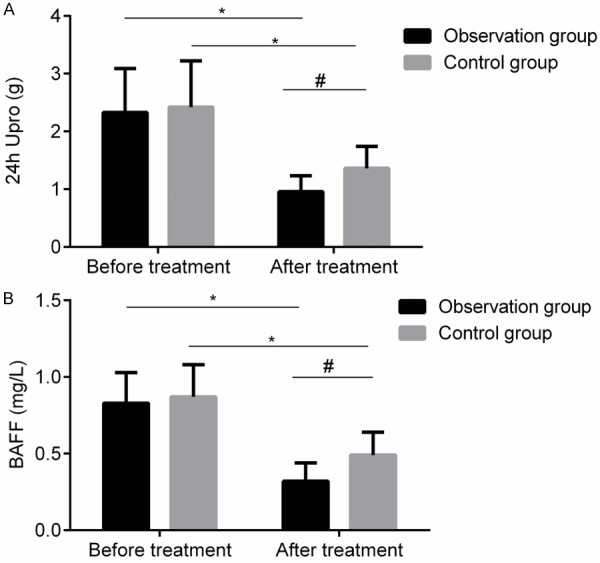
Comparison of 24 h Upro and BAFF levels before and after treatment in the two groups. A: 24 h Upro level; B: BAFF level. Compared with before treatment, *P<0.05; compared with control group, #P<0.05. BAFF: tumor necrosis factor family B cell activating factor; 24 h Upro: 24-hour urine protein.