
Figure 2.
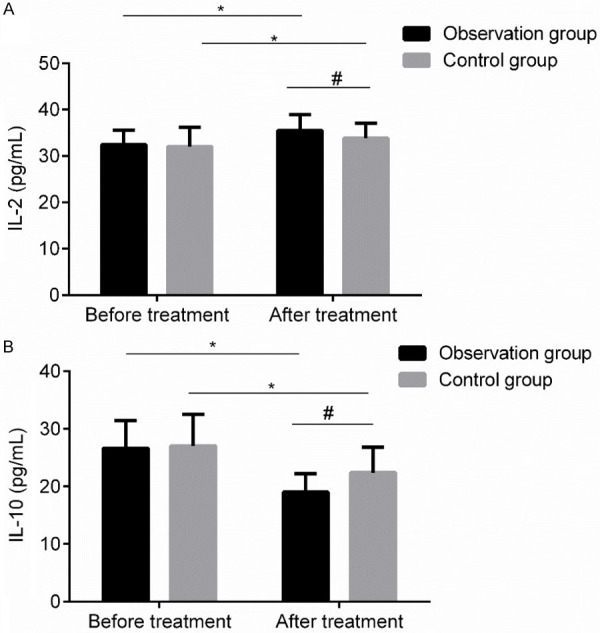
Comparison of the levels of inflammatory factors between the two groups of children before and after treatment. A: IL-2 level; B: IL-10 level. Compared with before treatment, *P<0.05; compared with control group, #P<0.05. IL-2: interleukin-2; IL-10: interleukin-10.